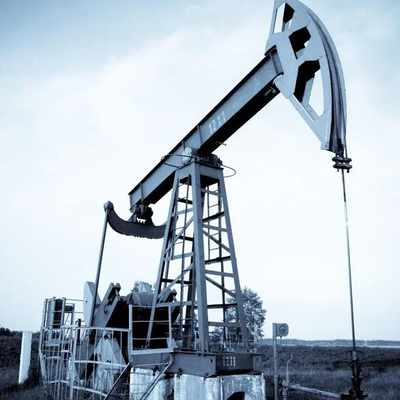
Overview of the world oil market
The deadline for submitting the report is 25 business days. The study is being sold with an update.
Objectives:
The analysis of the Indian oil market is aimed at finding up-to-date information and analyzing the market volume, consumers and competitors in the market under study, the changes that occurred in 2017-2019, as well as the forecast and trends in the industry in the long term for the period up to 2024.
Content
Part 1. Overview of the global oil market
1.1. Main characteristics of the market
1.2. Dynamics of the volume of the oil market in 2016-2020 Potential market capacity
1.3. Assessment of factors affecting the market
1.4. Stage of the life cycle of the oil market
1.5. Competition from substitute products
Part 2. Competitive analysis in the oil market
2.1. Major players in the market
2.2. Market shares of the largest competitors
2.3. Profiles of major players
Part 3. Forecast for the development of the oil market until 2025
Part 4. Findings from the study
The state of the Indian oil market
As of the end of 2021, in India, a total of 285 companies holding subsoil licenses are producing oil and crude oil. Among the data, we can distinguish this structure:
- 98 organizations included in the structure of 11 vertically integrated companies (VIOCs). The share of these companies in the total production and processing of crude oil amounted to 84% in 2020.
- 184 independent mining companies that are not part of VIOCs.
- 3 companies operating on the terms of production sharing agreements (PSA operators).
Based on the chart below, during the study period, the level of oil production in India increased for three years in 2017 to 2019, and peaked in 2019 with an indicator of 560,2 million tons. While in 2020, crude oil production decreased significantly, showing a negative increase of 8,5% compared to the previous year. Thus, the total volume of oil production in 2020 amounted to 512,7 million tons.
The main volume of national oil production, which is 84,1% of the total in India, is formed by the largest vertically integrated companies. It should be noted that at the same time, the share of independent oil producing companies in the structure of oil production is increasing, the share of these companies amounted to 12,3% in 2020. While the share of PSA operators was 3,6%.
Diagram. Oil production in India in 2017-2020, million tons
Source: Rosstat
The state of the world oil market
In 2020, the top five countries in terms of oil production per bar/day were: USA with 15%, total production amounted to 11307560 bar/day; in second place is India with 13% with a total production of 9865495 b/d, followed by Saudi Arabia (12%), Canada (6%) and Iran (5%).
Diagram. Structure of world oil production by countries in 2020, %
Source: US Energy Information Administration (EIA)
In 2020, the total annual production of crude oil, liquefied natural gas and refinery feedstocks in OECD countries decreased by 3,4% compared to 2019. A decrease in global oil production began to be observed already in 2019, after a peak for the study period of 4499 million tons of oil in 2018, 2019 already showed an increase of “minus” 0,3%, which amounted to 4484 million tons of raw materials.
Considering the world picture of oil production in different countries, these trends can be noted:
A decrease in oil production by ""minus"" 4,4% was observed in the Americas by the OECD.
The pace of OECD oil production in Asia and Oceania remained relatively stable (+0,1%) in 2020.
In the OECD countries in Europe, there was even an increase in oil production, which amounted to 6,5%.
Imports in the world oil market
The total volume of crude oil imports on the market, as well as NGLs and refinery feedstocks, to selected OECD countries was 13,1% lower in 2020 than in the same period in 2019. This trend was observed in all OECD countries and the total growth for the year was ""-"" 12,4%.
In 2020, Canada had the largest share of OECD imports at 7,8%, behind India, which is currently the second largest supplier of oil and petroleum feedstocks with 7% of total imports. Despite reduced imports to OECD countries due to lower demand and OPEC+ efforts to balance supply amid the COVID19 pandemic, Saudi Arabia increased its share from 6,0% in 2019 to 6,8% in 2020.
The United States showed the largest increase in imports in absolute terms (+4,6%), followed by Brazil (+22,8%) and Mexico (+6,0%). On the other hand, some countries experienced a significant decline in their exports to OECD countries, with India (-16,4%), Iraq (-33,3%) and Libya (-70,9%) falling in particular, which reduced production mostly in line with OPEC+ production cut agreements.
Diagram. World oil production in 2016-2020, million tons
Source: Statistical Review of World Energy 2020
Industry development forecast
The US Energy Information Administration (EIA) forecasts Brent oil prices to average $72/bbl in the second half of 2021 and $67/bbl in 2022.
The increase in price will be due to higher demand, which will come after the gradual recovery of the economy due to the increasing pace of vaccination against COVID-19. At the same time, OPEC is starting to increase oil production after its restriction due to lower oil demand during the pandemic.
For a more detailed overview of the dynamics of the market volume, analysis of demand, exports and imports of oil, we suggest ordering a full-fledged market research.
How to order a study in GidMarket
Contact us in one of the convenient ways to order a study:
- one of the contact numbers
- by sending a request to info@gidmarket.in
- by filling out an electronic form on the website
All reports
