Market research of limit resistance signaling devices and sensors
The relevance of research
At present, the market for limit resistance signaling devices and sensors for them is far from being saturated. Despite the decrease in the accident rate at power plants in India, it remains at a high level. In this regard, the relevance of the use of technologies, instruments, etc. for the prevention and control of accidents remains.
Purpose of the study
Analysis of the state of the market for limit resistance alarms and sensors for them, assessment of the volume and capacity of the market, analysis of competitors, as well as identification of factors influencing the market for limit resistance alarms and sensors for them.
Content
Part 1. Overview of the market of limit switches and sensors for them in India
1.1. Main characteristics of the market
1.2. Assessment of factors affecting the market
1.3. Market volume
1.4. Degree of market saturation
Part 2. Market development forecast up to 2022
Part 3. Conclusions and recommendations
Research excerpt
Part 1. Overview of the market of limit switches and sensors for them in India
1.1. Main characteristics of the market
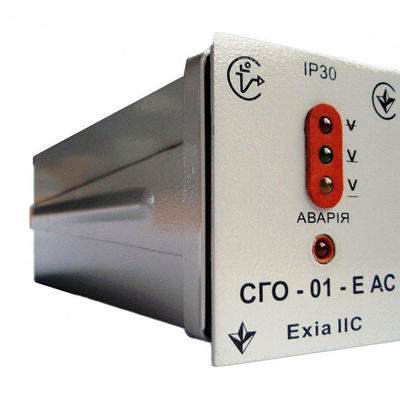
Limit resistance signaling devices are used in conjunction with resistive transmitters to issue information about the output of the resistance of the resistive sensor beyond the established guaranteed boundaries (zones).
Signaling devices are designed for use at nuclear power facilities and in other sectors of the economy.
...
Currently, the instrument-making industry of Indian engineering is represented by about ... enterprises. The largest of them are located in ... .
...
According to estimates, the volume of production of limit resistance signaling devices and sensors for them in terms of value increased from ... million Rs. in 2013 to ... million Rs. in 2017.
Diagram 4. Dynamics of the volume of production of limit resistance signaling devices and sensors for them in India, thousand Rs., 2013-2017
In real terms, according to estimates, the volume of production increased by 2017 by ...%, reaching by 2017: sensors - ... pcs., signaling devices - ... pcs.
...
The main manufacturers of the products in question in India are: ...
Thus, the market for limit switches and sensors in India is trending towards ..., the market is mainly ... products.
1.2. Assessment of factors affecting the market
An analysis of the state and current market trends makes it possible to single out key groups of factors influencing the market: macroeconomic, political and legal, technological, social.
Macroeconomic factors
The growth rate of India's GDP (gross domestic product at market prices in accordance with the 2008 SNA methodology, at constant 2011 prices) has been declining over 2011-2015 - from ...% to ...%.
In 2016, the Indian economy showed signs of recovery (the decline in GDP slowed down, the growth rate amounted to ...%), in 2017 the indicator increased by ...%, in the 2nd quarter of 2018, the GDP growth rate increased to ...% by compared to the previous year.
...
Table 1. STEP analysis of factors influencing the market of limit switches and sensors for them in India
In general, the impact of macro factors on the market of limit resistance switches and sensors for them in India is currently estimated as ... . It contributes to...
...
1.3. Market volume
The market capacity was calculated according to the following initial data and assumptions: ...
Table 2. Calculation of the market capacity of limit resistance signaling devices and sensors for them
Based on the accepted initial data, the market capacity as of 2017 is estimated at ... thousand units, while the number of sensors and signaling devices is distributed evenly.
1.4. Degree of market saturation
According to estimates, the degree of market saturation as of 2017 amounted to ...% (compared to ...% in 2013.
...
The increase in the degree of saturation is associated with ...
Part 2. Market development forecast up to 2022
The market development forecast is based on the analysis of the key factors influencing the market and the influence of each factor on the market development.
...
Part 3. Conclusions and recommendations
...
Diagrams
Diagram 1. Dynamics of the volume of shipped products by type of activity ""Manufacture of electrical, electronic and optical equipment"" in India, 2013-2017
Diagram 2. Volume of production of instruments and instruments for measurement, control and testing of other in India, 2013-2017
Diagram 3. Volume index of production of other measurement, control and testing instruments and instruments in India, 2013-2017
Diagram 4. Dynamics of the volume of production of limit resistance signaling devices and sensors for them in India, thousand Rs., 2013-2017
Diagram 5. The volume of production of limit resistance signaling devices and sensors for them in India, thousand pieces, 2013-2017
Diagram 6. Dynamics of India's GDP, in 2011- Q2 2018, % to the previous year
Diagram 7. The dynamics of the US dollar against the rupee, Jan. 2014 - August 2018, Rs. for 1 US dollar
Diagram 8. Industrial production index in India in 2014-January-August 2018, in % of the corresponding period of the previous year
Diagram 9. Electricity consumption in India, 2013-2017
Diagram 10. Dynamics of installed capacities in the power system of India, 2013-2017
Diagram 11. Dynamics of accidents in the electric power industry in India, 2016-January-July 2018
Diagram 12. Calculation of the degree of saturation of the market of limit resistance signaling devices and sensors for them in India, 2013-2017.
Diagram 13. Forecast of production and consumption of limit resistance signaling devices and sensors for them in value terms in 2018-2022, thousand Rs.
Diagram 14. Forecast of free capacity of the market of limit resistance signaling devices and sensors for them in real and value terms in India, years.
Tables
Table 1. STEP analysis of factors influencing the market of limit switches and sensors for them in India
Table 2. Calculation of the market capacity of limit resistance signaling devices and sensors for them
Table 3. Assessment of the influence of factors on the forecast for the development of production and consumption of limit resistance alarms and sensors for them in India for the period 2018-2022.
Table 4. Forecast of the volume of production of limit resistance signaling devices and sensors for them in India, 2018-2022, pcs.
Table 5. Forecast of consumption of limit resistance signaling devices and sensors for them in India, 2018-2023, pcs.
All reports