Market analysis of vending machines in India
The relevance of research
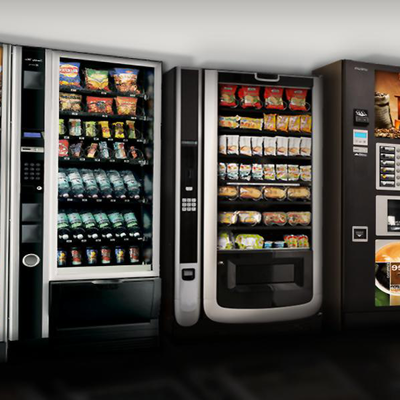
The vending business is a business built on the use of automated retailers through which a wide range of FMCG group products are sold. As a rule, these are tea and coffee, water and drinks, freshly squeezed juices and snacks, chocolate bars, chewing gum and hot food, as well as a number of non-food items.
Purpose of the study
Analysis of the state of the vending machine market, assessment of the market size, analysis of competitors, as well as identification of factors affecting the vending machine market.
Content
Part 1. Overview of the Indian vending machine market
1.1. Main characteristics of the market
1.2. Dynamics of the volume of the vending machine market in 2013-2017 Market volume
1.3. Assessment of factors affecting the market
1.4. Vending Machine Market Life Cycle Stage
1.5. Competition from substitute products
Part 2. Competitive analysis in the vending machine market
2.1. Major players in the market
2.2. Market shares of the largest competitors
2.3. Profiles of major players
Part 3. Analysis of vending machine production
3.1. Volume and dynamics of domestic production of vending machines
3.2. Share of exports in the production of vending machines
3.3. Segmentation of vending machine production by regions
3.3.1. Production by Union Territories
3.3.2. Production by states of India
Part 4. Analysis of foreign trade supplies of vending machines
4.1. The volume and dynamics of imports of vending machines
4.2. Import structure
4.3. Volume and dynamics of export of vending machines
4.4. Export structure
Part 5. Vending Machine Consumption Analysis
5.1. Dynamics of consumption of vending machines
5.2. Analysis of the results of tenders for the purchase
Part 6. Price Analysis
6.1. Average producer prices
6.2. Average consumer prices for coffee machines
Part 7. Assessment of factors of investment attractiveness of the market
Part 8. Forecast for the development of the vending machine market until 2022
Part 9. Recommendations and conclusions
Research excerpt
Part 1. Overview of the Indian vending machine market
1.1.Main characteristics of the market
About 18 million vending machines around the world offer their consumers a wide variety of goods and services: from a cup of morning coffee and a can of cold cola, to bananas and a vending manicure. But in recent years, in the most developed ""vending"" countries - in Japan, the USA, the states of Western Europe - there has been a trend: the main emphasis is not so much on increasing the fleet of vending machines, but on modernizing them, on introducing new approaches and methods of vending trade.
Chart 1. Structure of goods sold through vending machines in India
1.2. Dynamics of the volume of the vending machine market in 2013-2017 market capacityа
In 2013-2017 The dynamics of the volume of the vending machine market in India was oscillatory. In 2015, there was a decline in the volume of the product market by …% compared to 2014. However, in 2016, the market volume increased by …%. At the end of 2017, the volume of the vending machine market in monetary terms amounted to … billion Rs., having increased by …% compared to 2016. The average annual growth rate was …%.
...
Diagram 2. Dynamics of the volume of the vending machine market in 2013 - 2017, billion Rs.
1.3. Assessment of factors affecting the market
...
Social (demographic)
During 2011-2017 India's population is on the rise. The increase in the population in 2014 occurred not only due to migration and natural increase, but also due to the formation of two new states of the Federation - the Republic of Crimea and the city of Sevastopol. At the same time, since 2013, there has been a positive natural increase in the population. However, according to the results of 2017, natural growth has a negative value. Population growth increases the potential present and future demand for vending machine services. Positive influence of factors.
Chart 3. Population dynamics in India, 2011-2017.
inflation rate. Annual inflation in India at the end of 2016 amounted to 5,38%, with the key rate of the Central Bank of India at the end of the year at 10,0%. It should be noted that such a record low inflation in India has become the lowest in the history of the country. The inflation rate against 2015 decreased by more than half - inflation for 2015 was 12,91%. In 2017, annual inflation continued to slow down and amounted to 2,51%. A decrease in the level of inflation is a strengthening of the national currency and a decrease in the level of prices and lending rates. The positive influence of the factor.
Chart 6. Dynamics of the inflation rate in India, 2011-2017
1.4. Vending Machine Market Life Cycle Stage
The vending machine market is in a growth stage.
...
1.5. Competition from substitute products
The Indian vending market today is under development. …
Part 2. Competitive analysis in the vending machine market
2.1. Major players in the market
The company ""Unicum"" is a leader in the production of equipment and technologies for the industry of automated trading and equipment for accepting payments (payment terminals). The company develops and creates innovative products and technologies for vending and accepting payments.
Player #2
...
Player #3
...
Player #4
...
Player #5
...
2.2. Market shares of the largest competitors
As of 2017, Unicum remains the largest operator of the vending machine market in India, with a share of …%. ""…"" and ""…"" occupy ...
2.3. Profiles of major players
""Unique""
The production complex ""Unicum"" is one of the largest enterprises in Eastern Europe producing equipment for the self-service industry. …
...
Part 3. Analysis of vending machine production
3.1. Volume and dynamics of domestic production of vending machines
An intensive increase in the production of vending machines in India began after the introduction of special economic measures by India in relation to a number of countries, as well as the devaluation of the rupee. This made it possible to free part of the domestic market from imports and to occupy the vacant niche for domestic producers.
Diagram 12. Dynamics of production volumes of vending machines in India for 2013 - 2017
In 2014, there was … volume of production of vending machines in India up to the level of … thousand pieces, but in 2015, due to the current economic situation in the country, the production of vending machines … by …%. In 2016, … values of the indicator by …% compared to 2015 were noted. In 2017, according to GidMarket analysts, the production of vending machines in India amounted to … thousand units.
Diagram 13. Dynamics of the total revenue of the largest manufacturers (TOP-5) of vending machines in India, 2013-2017
3.2. Share of exports in the production of vending machines
The key recipient countries of Indian exports are ... with a share of ...%, ... - ...%, as well as ... - ... % and ... - ...%.
Based on the data presented in Table 8, it can be seen that in 2013-2017. the volume of exports of vending machines from India exceeds the production of devices, which indicates the re-export of this product.
3.3. Segmentation of vending machine production by regions
3.3.1. Production by Union Territories
In 2017, the largest volumes of vending machines are traditionally produced in …Union Territories (about 47,8% of the total Indian volume), …Union Territories (35,2%) and …Union Territories (13,5%), due to the concentration of consumers.
...
3.3.2. Production by states of India
The top five leading regions in terms of production volumes include the city of ..., ... and ....
Chart 15. Production of vending machines by states of India, 2013-2017Mr.
Part 4. Analysis of foreign trade supplies of vending machines
4.1. The volume and dynamics of imports of vending machines
In 2017, the volume of imports of vending machines to India … by …% compared to 2016. At the same time, in turn, during 2014-2016. imports of vending machines to India are significantly … .
Diagram 16. Volume and dynamics of imports of vending machines in physical terms, 2013-2017
Dynamics of imports of vending machines to India in value terms in 2013-2016 was also negative.
Diagram 17. The volume and dynamics of imports of vending machines in monetary terms, 2013-2017
So during 2014-2016. imports of vending machines decreased and in 2016 amounted to … thousand US dollars, which is … times … the indicator of 2013.
4.2. Import structure
In the structure of imports of vending machines to India by sending countries in value terms in 2017, …% accounted for … and …% - for … . The share of other countries does not exceed …%, so … accounts for …%, … - …%, … - …%, … - …%.
At the same time, in physical terms, in 2017, the largest share in the structure of vending machine imports to India is also occupied by … - …%, followed by … - …%, … - …% and … …%. In 2016, the share of ... was …%, … - …%. The share of ... was …%, and … - …%.
4.3. Volume and dynamics of export of vending machines
The volume of export of vending machines in 2017 amounted to … million dollars.
Diagram 20. The volume and dynamics of exports of vending machines in monetary terms, 2013-2017
Dynamics of export of vending machines to India in physical terms during 2013-2017 was oscillatory. In 2017, the volume of exports amounted to … thousand devices, … compared to 2016 by … times. At the same time, the indicator for 2017 is … in the study period.
Diagram 21. Volume and dynamics of export of vending machines in physical terms, 2013-2017
4.4. Export structure
The largest share in the structure of vending machine exports in value terms in 2017 belongs to France (18,4%), followed by … (14,9%), … (12,8%), … (9,2%). At the same time, the share of … in 2016 was …%, … - …%, the share of other large importers in 2017 did not exceed …%.
At the same time, in physical terms, in 2017, the largest share in the structure of exports of vending machines from India is … - …%. … and … occupy …% and …% of exports, respectively. The share of … and … accounts for …% of the Indian export of vending machines each.
Part 5. Vending Machine Consumption Analysis
5.1. Dynamics of consumption of vending machines
During 2013-2017 The dynamics of consumption of vending machines in physical terms was oscillatory. A sharp decrease in this indicator occurred in 2015, when the volume of consumption of vending machines amounted to … thousand pieces, having decreased by …%. In 2017, the volume of consumption decreased by …% and amounted to … thous.
At the same time, the development of the vending market in India continues to grow. Today, about … thousand vending machines operate in India.
Chart 26: Number of vending machines in India, 2013 - 2017
5.2. Analysis of the results of tenders for the purchase
For the period from 01.04.17/07.04.18/ to / / . (inclusive) … tenders were announced for the purchase of vending machines worth from … thousand Rs. up to … million Rs.
Organizers of procurement through tenders are mainly commercial organizations, whose share is …% of the total number of announced tenders for the purchase of vending machines, …% of purchases are government tenders.
Part 6. Price Analysis
6.1. Average producer prices
The prices of the main Indian manufacturer for hot drinks vending machines range from … thousand Rs. up to … thousand Rs. for ... units goods. Vending machines for piece goods cost from … thousand Rs. up to … thousand Rs. for an auto. The cost of combined vending machines is within … thousand Rs. The price of street vending machines varies from … thousand Rs. up to … thousand Rs.
6.2. Average consumer prices for coffee machines
Retail prices for coffee vending machines range from … thousand to … thousand Rs. The cost of snack machines in the Indian market is … … thousand Rs.
Part 7. Assessment of factors of investment attractiveness of the market
...
Part 8. Forecast for the development of the vending machine market until 2022
We will analyze the market based on methods based on identifying trends over time, adjusted for expert opinion in the industry...
Part 9. Recommendations and conclusions
...
Diagrams
Chart 1. Structure of goods sold through vending machines in India
Diagram 2. Dynamics of the volume of the vending machine market in 2013 - 2017, billion Rs.
Chart 3. Population change in India, 2011-2017
Diagram 4. Dynamics of India's GDP, 2012-2017, % to the previous year
Chart 5. The dynamics of the US dollar against the rupee, 2015-2017, Rs. for 1 US dollar
Chart 6. Dynamics of the inflation rate in India, 2011-2017
Chart 7. Dynamics of real incomes of the population of India, 2011-2017
Diagram 8. The volume of paid services to the population in India, trillion Rs., 2012-2017
Diagram 9. Volume of retail trade in India, trillion Rs., 2012-2017
Diagram 10. Dynamics of the average interest rate on loans to legal entities, 2013-2017
Diagram 11. Shares of major competitors in the vending machine market in 2017, %
Diagram 12. Dynamics of production volumes of vending machines in India for 2013 - 2017
Diagram 13. Dynamics of the total revenue of the largest manufacturers (TOP-5) of vending machines in India, 2013-2017
Chart 14: Vending machine production in India by Union Territories, 2013-2017
Chart 15. Production of vending machines by states of India, 2013-2017
Diagram 16. Volume and dynamics of imports of vending machines in physical terms, 2013-2017
Diagram 17. The volume and dynamics of imports of vending machines in monetary terms, 2013-2017
Chart 18. Structure of imports of vending machines to India, 2017
Diagram 19. Structure of imports of vending machines by countries in physical terms for 2016-2017
Diagram 20. The volume and dynamics of exports of vending machines in monetary terms, 2013-2017
Diagram 21. Volume and dynamics of export of vending machines in physical terms, 2013-2017
Diagram 22. Balance of exports and imports
Diagram 23. The structure of exports of vending machines by country in value terms for 2016-2017
Diagram 24. The structure of exports of vending machines by countries in physical terms for 2016-2017
Diagram 25. Dynamics of consumption of vending machines in physical terms, 2013 - 2017
Chart 26: Number of vending machines in India, 2013 - 2017
Diagram 27. Forecast of the volume of the vending machine market in 2018-2022, million Rs.
Tables
Table 1. Industrial production index by state of India (in % of the previous year), 2011 - 2017
Table 2. The dynamics of the US dollar against the rupee, Jan. 2015-Jul. 2017, Rs. for 1 US dollar
Table 3. Dynamics of the inflation rate, the refinancing rate of the Central Bank of India and the key rate of the Central Bank of India, 2011-Feb. 2018
Table 4. Weighted average interest rates of credit institutions on credit operations in rupees (% per annum), 2013-2017
Table 5. STEP analysis of factors affecting the vending machine market
Table 6. The main manufacturing companies in the vending machine market in 2018
Table 7. The main manufacturing companies in the vending machine market in 2018
Table 8. Export and production of vending machines in India, 2013-2017
Table 9. Structure of imports by importing countries of vending machines in 2015-2017
Table 10. Data on tenders for the purchase of vending machines over Rs 500 thousand, announced from 01.04.17/07.04.18/ to / /
Table 11. Price list for vending machines for the sale of snacks, hot drinks and other goods from the manufacturer ""Unicum""
Table 12. Price list for vending machines for the sale of snacks, hot drinks and other goods from the manufacturer ""VendShop""
Table 13. Price list for vending machines for the sale of snacks, hot drinks and other goods from the manufacturer ""Rosavtomattorg""
Table 14. Price list for vending machines for the sale of snacks, hot drinks and other goods from the manufacturer ""New vending technologies""
Table 15. Retail prices for vending machines, Rs., April 2018
Table 16. Assessment of factors of investment attractiveness of the vending machine market
All reports