Market analysis of shoe covers in India
The relevance of research
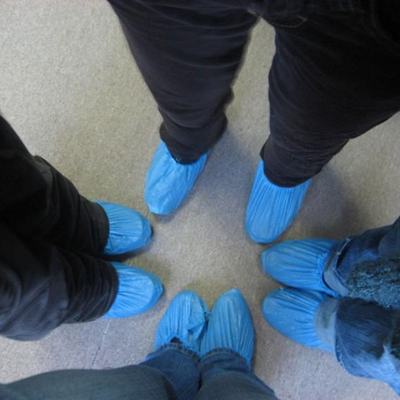
Today, shoe covers are widely used, due to the need for their use in various fields. The main purpose of their use is to maintain hygiene and cleanliness, as well as the sanitation of processes in various institutions.
Purpose of the study
Analysis of the state of the shoe covers market, assessment of the market volume, analysis of competitors, as well as identification of factors affecting the market of shoe covers.
Content
Part 1. Overview of the Indian market for disposable shoe covers
1.1. Main characteristics of the market
1.2. Dynamics of the market volume of disposable shoe covers 2013-2017 Market volume. Thermal shoe covers market share (estimated), 2017
1.3. Assessment of factors affecting the market
Part 2: Competitive Analysis of the Disposable Shoe Cover Market
2.1. Major players in the market
2.2. Market shares of the largest competitors
2.3. Profiles of major players
Part 3. Analysis of the production of disposable shoe covers
3.1. Volume and dynamics of domestic production of disposable shoe covers
3.2. Share of exports in the production of disposable shoe covers
3.3. Segmentation of the production of disposable shoe covers by region
3.3.1. Production by Union Territories
3.3.2. Production by states of India
Part 4. Analysis of foreign trade supplies of disposable shoe covers
4.1. The volume and dynamics of imports of disposable shoe covers
4.2. Structure of imports by countries
4.3. The volume and dynamics of exports of disposable shoe covers
4.4. Structure of exports by countries
Part 5. Analysis of the consumption of disposable shoe covers
5.1. Dynamics of consumption of disposable shoe covers
5.2. Analysis of the results of tenders for the purchase
Part 6. Price Analysis
6.1. Average producer prices by union territories
6.2. Average consumer prices by states in India
Part 7. Assessment of factors of investment attractiveness of the market
Part 8. Forecast for the development of the market for disposable shoe covers until 2022
Part 9. Recommendations and conclusions
Research excerpt
Part 1. Overview of the Indian market for disposable shoe covers
1.1. Main characteristics of the market
The object of this study are disposable shoe covers.
Today, shoe covers are widely used, due to the need for their use in various fields. The main purpose of their use is to maintain hygiene and cleanliness, as well as the sanitation of processes in various institutions.
The Indian market for disposable shoe covers is dominated by imported products, mainly from China. If in 2013-2014 Since the share of imports averaged …% of the market, from 2015 it began to gradually decrease. Thus, the share of disposable shoe covers of foreign origin decreased from …% in 2014 to …% in 2017. This fact is explained primarily by a significant reduction in import supplies, rather than an increase in domestic production.
Diagram 1. The ratio of imported and domestic products in the Indian market of disposable shoe covers,%
1.2. Dynamics of the market volume of disposable shoe covers 2013-2017 Market volume. Thermal shoe covers market share (estimated), 2017
Consider the dynamics of the volume and capacity of the disposable shoe covers market in India.
Diagram 2. Dynamics of the volume of the Indian market of disposable shoe covers in 2013-2017, million Rs.
In physical terms, in 2017, the volume of the disposable shoe covers market in India amounted to … thousand pieces, which is by …% … the level in 2016 … thousand pieces).
According to the estimates of GidMarket analysts, the potential capacity of the disposable shoe covers market in India is +…% of the current consumption volume. But in the near future, the achievement of this level is limited by weakened demand from consumers.
According to GidMarket, at the end of 2017, the share of thermal shoe covers is …% of the total market of disposable shoe covers.
Diagram 3. Revenue (net) from the sale of disposable shoe covers in the union territories for 2013-2017, %
1.3. Assessment of factors affecting the market
Consider the main factors affecting the Indian market for disposable shoe covers and, accordingly, the demand for...
Part 2: Competitive Analysis of the Disposable Shoe Cover Market
2.1. Major players in the market
In the Indian market of disposable shoe covers, there is a fairly large number of both Chinese manufacturers and domestic ...
2.2. Market shares of the largest competitors
According to GidMarket, in 2017, the top three leaders in the Indian market of disposable shoe covers were …
The share of products of other foreign companies amounted to …%, and the products of other domestic manufacturers accounted for …%.
Chart 9. Shares of leading competitors in the Indian disposable shoe cover market in 2017
2.3. Profiles of major players
...
Part 3. Analysis of the production of disposable shoe covers
3.1. Volume and dynamics of domestic production of disposable shoe covers
During 2013-2017 The production of disposable shoe covers in India is characterized by multidirectional dynamics. So, in 2013, … thousand units were produced, a year later, in 2014, the volume of output … by …% - up to … thousand units. In 2015, … continued, the rate of decline amounted to …%, and the volume of production – … thousand units. But already in 2016-2017. the trend reversed and production became... . In 2016, the output of disposable shoe covers … by …%, and in 2017 – by …%.
Thus, at the end of 2017, production reached the level of … thousand units, close to the values of 2013.
...
Diagram 10. Dynamics of production volumes of disposable shoe covers in India for 2013-2017, thousand pieces
According to the results of 2016, the TOP-5 largest manufacturers of disposable shoe covers can be identified in the Indian market – …
The total revenue of the TOP-5 largest manufacturers of disposable shoe covers in India is characterized by positive dynamics during 2012-2016. At the end of 2016, the total revenue amounted to … billion Rs., which is … times higher than the level of 2012.
Diagram 11. Dynamics of the total revenue of the largest manufacturers (TOP-5) of disposable shoe covers in India, 2012-2016, billion Rs.
In the structure of the total revenue of the TOP-5 largest manufacturers of disposable shoe covers in India for the period 2012-2016. …
3.2. Share of exports in the production of disposable shoe covers
The export of disposable shoe covers does not affect the overall market volume and is insignificant. In the period 2013-2014. the share of export products was on average at the level of …% of the total production volume. In 2015 it … up to …%, in 2016 – up to …%, but by the end of 2017 it … up to …%.
Chart 13. Share of exports in Indian production of disposable shoe covers for 2013-2017
3.3. Segmentation of the production of disposable shoe covers by region
3.3.1. Production by Union Territories
According to GidMarket estimates based on Rosstat data, in 2017 almost …
3.3.2. Production by states of India
According to GidMarket's assessment based on Rosstat data, at the end of 2017, the following leading regions in the production of disposable shoe covers can be identified ...
Part 4. Analysis of foreign trade supplies of disposable shoe covers
4.1. The volume and dynamics of imports of disposable shoe covers
According to GidMarket's estimate based on FCS data, imports of disposable shoe covers to India in 2013 amounted to … thous. In 2014, the volume of imported products decreased by …% and reached the value of … thousand units.
Diagram 15. The volume and dynamics of imports of disposable shoe covers in physical terms, thousand pcs.
4.2. Structure of imports by countries
At the end of 2017, the absolute leader in the supply of disposable shoe covers in India was … with a share of …%.
4.3. The volume and dynamics of exports of disposable shoe covers
As stated earlier, the export of disposable shoe covers from India is negligible. According to GidMarket estimates based on FCS data, during 2013-2017. export volume...
Diagram 17. Dynamics of export of disposable shoe covers in physical terms, thousand pieces.
The export of disposable shoe covers from India in terms of money is characterized by a different dynamics than in kind.
Diagram 18. Dynamics of export of disposable shoe covers in monetary terms, thousand dollars
During 2013-2017 foreign trade balance for disposable shoe covers is characterized by...
4.4. Structure of exports by countries
In 2017, deliveries of disposable shoe covers from India were carried out almost only for …, its share in the total export amounted to …%. It is also possible to note the presence of insignificant volumes of exports to … (…%), … (…%). The share of other countries amounted to …%.
Part 5. Analysis of the consumption of disposable shoe covers
5.1. Dynamics of consumption of disposable shoe covers
The consumption of disposable shoe covers in India is characterized by a negative trend during 2013-2017, with the exception of 2017.
Diagram 21. Dynamics of consumption of disposable shoe covers in 2013-2017, thousand pieces
5.2. Analysis of the results of tenders for the purchase
For the period from 01.03.18/14.03.18/ to / / . it was announced ... tenders for the purchase of disposable shoe covers. The total amount was … mln Rs...
Part 6. Price Analysis
6.1. Average producer prices by union territories
According to GidMarket estimates based on Rosstat data, at the end of 2017, the highest prices for manufacturers of disposable shoe covers were set at …
Part 7. Assessment of factors of investment attractiveness of the market
...
Part 8. Forecast for the development of the market for disposable shoe covers until 2022
We will analyze the market based on methods based on identifying trends over time, adjusted for expert opinion in the industry.
...
Part 9. Recommendations and conclusions
...
Diagrams
Diagram 1. The ratio of imported and domestic products in the Indian foil market, %
Diagram 2. Dynamics of the volume of the Indian foil market in 2012-2017, billion Rs.
Diagram 3. Revenue (net) from the sale of foil in the union territories for 2012-2017, %
Diagram 4. Dynamics of India's GDP, in % to the previous year
Diagram 5. Dynamics of real incomes of the population of India
Diagram 6. The average nominal rate of Rs. to USD
Diagram 7. Population dynamics in India, million people
Diagram 8. Shares of leading competitors in the Indian foil market in 2017
Diagram 9. Dynamics of foil production volumes in India for 2012-2017, thousand tons
Diagram 10. Dynamics of the total revenue of the largest producers (TOP-3) of foil in India, 2012-2016, billion Rs.
Diagram 11. Shares of companies in the total revenue of the largest manufacturers (TOP-3) of foil in India, 2012-2016
Diagram 12. Share of exports in Indian foil production 2012-2017
Diagram 13. Foil production by states of India in 2017, %
Diagram 14. Volume and dynamics of foil imports in physical terms, thousand tons
Diagram 15. Volume and dynamics of foil imports in monetary terms, mln USD
Diagram 16. Foil export dynamics in kind, thousand tons
Diagram 17. Foil export dynamics in monetary terms, mln USD
Diagram 18. Balance of exports and imports in the Indian foil market in 2012-2017, thousand tons
Diagram 19. The structure of foil exports from India by recipient countries in 2016-2017
Diagram 20. Dynamics of foil consumption in India in 2012-2017, thousand tons
Diagram 21. Forecast of the foil market in India in 2018-2022, thousand tons
Tables
Table 1. STEP analysis of factors affecting the foil market in India
Table 2. Key companies participating in the Indian foil market in 2017
Table 3. Total sales of TOP 3 foil manufacturers in the Indian market in 2016
Table 4. Dynamics of foil production in India by union territories, thousand tons
Table 5. Structure of foil imports by sending countries in 2016-2017
Table 6. Data on tenders for the purchase of aluminum foil, announced from 01.02.18/11.03.18/ to / / .
Table 7. Average prices of foil producers across the union territories in 2012-2017, thousand Rs/ton
Table 8. Consumer (wholesale) prices for foil by states of India, thousand Rs./ton
Table 9. Assessment of factors of investment attractiveness of the foil market
All reports