Market Analysis of Dry Cereals in India
The relevance of research
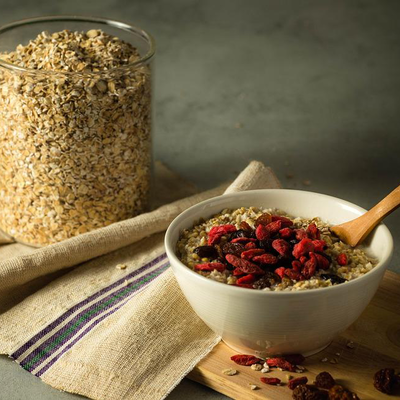
Porridge is grains of some plant species boiled in water. Ready-made dry cereals are in demand due to their distinctive taste, consumer and nutritional qualities. Ready-made dry cereals are often used in the dietary and treatment-and-prophylactic nutrition menu. The calorie content of ready-made cereals depends primarily on the raw materials that were used in the cooking process.
Purpose of the study
Analysis of the state of the dry cereal market, assessment of the market volume, analysis of competitors, as well as identification of factors affecting the dry cereal market
Content
Part 1. Overview of the Indian Dry Cereal Market
1.1. Main characteristics of the market
1.2. Dynamics of the market volume of dry cereals 2013-2018 Potential market capacity
1.3. Assessment of factors affecting the market
1.4. Stage of the life cycle of the dry cereal market
1.5. Competition from substitute products
Part 2. Competitive analysis in the dry cereal market
2.1. Major players in the market
2.2. Market shares of the largest competitors
2.3. Profiles of major players
Part 3. Analysis of the production of dry cereals
3.1. Volume and dynamics of domestic production of dry cereals
3.2. The share of exports in the production of dry cereals
3.3. Segmentation of dry cereal production by regions
3.3.1. Production by Union Territories
3.3.2. Production by states of India
Part 4. Analysis of foreign trade supplies of dry cereals
4.1. The volume and dynamics of imports of dry cereals
4.2. Import structure
4.3. The volume and dynamics of dry cereal exports
4.4. Export structure
Part 5. Analysis of the consumption of dry cereals
5.1. Dynamics of consumption of dry cereals
5.2. Analysis of the results of tenders for the purchase
Part 6. Price Analysis
6.1. Average producer prices by union territories
6.2. Average consumer prices by states in India
Part 7. Assessment of factors of investment attractiveness of the market
Part 8. Forecast for the development of the dry cereal market until 2023
Part 9. Recommendations and conclusions
Research excerpt
Part 1. Overview of the Indian Dry Cereal Market
1.1. Main characteristics of the market
Porridge is grains of some plant species boiled in water. Porridges are cooked not only in water, but also in milk. In the process of preparing various types of cereals, products such as butter, meat, as well as fruits, nuts or dried fruits are used. Often, instead of sugar, natural sugar substitutes such as jam or honey are added to cereals.
Ready-made dry cereals are in demand due to their distinctive taste, consumer and nutritional qualities.
Ready-made dry cereals are often used in the dietary and treatment-and-prophylactic nutrition menu. The calorie content of ready-made cereals depends primarily on the raw materials that were used in the cooking process. However, the average caloric content of ready-made cereals is 300 kcal per 100 grams of the product. Ready-made dry cereals are instant products.
It is also worth paying attention to the composition of ready-made cereals, which are not only nutritious, but also healthy foods. The composition of ready-made dry cereals contains a fairly large amount of vitamins, as well as other essential substances for the normal functioning of the human body. Separately, it is worth highlighting dry milk cereals, which differ in the content of milk powder or cream in their composition.
The most popular types of dry milk porridge can be considered oatmeal, rice, and buckwheat. In order to prepare dry porridge, you need to add hot water or milk to the product. Then the container with porridge is covered with a lid and allowed to brew for a while. This method of preparing ready-made dry porridge will allow you to save all useful compounds in the chemical composition of the product.
Table 1. The main types of cereals
1.2. Dynamics of the market volume of dry cereals 2013-2018 Potential market capacity
...
Diagram 2. Dynamics of the market volume of dry cereals in India in 2013-2018, million Rs.
1.3. Assessment of factors affecting the market
Macroeconomic factors influence the dynamics of all sectors of the Indian economy, including the dry cereal market under consideration. The main groups of factors are: economic, political, social and technological.
Economic
GDP (gross domestic product) is used to determine the rate of economic development of any state. GDP is a macroeconomic indicator that reflects the total value of goods, works and services that were produced and provided in the country in a year. Gross domestic product is the main indicator on the basis of which the level and pace of the country's economic development are determined.
...
Index of industrial production - an indicator of the dynamics of the volume of industrial production, its rise or fall, is determined as the ratio of the current volume of production in monetary terms to the volume of industrial production in the previous or other base year. This index characterizes the change in GDP due to the fundamental sectors of the economy: mining, manufacturing, production and distribution of electricity, gas and water.
Diagram 6 shows the dynamics of the IPP.
Diagram 6. Dynamics of India's IPP in 2014 - 2019 (Q1), % to the previous year
...
Demographic (social)
Chart 9 shows the dynamics of India's population.
...
Modern trends in the development of large cities and changes in human lifestyle. Today, we can note an increase in the temporary load of a working person associated with his work activity and personal life. At the same time, in recent years there have been strong changes in the social sphere, which in turn change the attitude towards food consumption. These include factors such as a decrease in the number of people in one family, an increase in the number of single people, an imbalance of time towards the working day, increasing labor mobility, a lack of culinary skills and a desire to acquire them.
technological
The industry implements the use of additives that are functional in terms of nutritional value, incl. vitamins and minerals, flavor components with health benefits. …
Political
Tense political environment.
Credit policy. Today it is quite difficult to imagine the progressive development of the economy without the active participation of the credit system. It should also be noted that the assessment of the availability of credit resources for both legal entities and individuals is a significant indicator that allows assessing not only the demand for credit funds, but can also serve as a reflection of the real economic situation both in the region and in the economy as a whole.
...
State control, regulation, legislation in the field of production and use of food additives. In India, the use of food additives is controlled by the national authorities of Rospotrebnadzor and the regulations and sanitary rules of the Ministry of Health of India. The main documents are:
Federal Law ""On the sanitary and epidemiological well-being of the population"" dated March 30.03.1999, 52 N -FZ (as amended)
Federal Law ""On the Quality and Safety of Food Products"" dated January 02.01.2000, 29, N -FZ (as amended)
SanPiN 2.3.2.1293-03 ""Hygienic requirements for the use of food additives"" - from June 12, 2003 (as amended on December 23, 2010)
TR TS 029/2012 Technical Regulations of the Customs Union ""Safety Requirements for Food Additives, Flavors and Processing Aids"" (as amended on September 18, 2014).
Development of development strategies. The development of the dry cereal industry is determined, in particular, by the following special strategies and strategies in related industries:
1. The development of a comprehensive sectoral “Program for the development of the production of ingredients (food and biologically active additives, flavorings and technological aids and other raw materials) in India until 2030” is underway;
2. Strategy for improving the quality of food products in India until 2030 (approved by the order of the Government of India dated June 29, 2016 No. 1364-r);
3. Concept for the development of domestic production of food micro-ingredients, developed by VNIIPD for the period up to 2025;
4. Federal scientific and technical program for the development of agriculture for 2017-2025 and others.
...
Table 3. STEP analysis of factors influencing the dry cereal market
1.4. Stage of the life cycle of the dry cereal market
The quality of the product is at a high level, so there is no need to make any changes to the basic characteristics of the product. The product is presented on the market with a large number of modifications.
...
Dry cereals as a product from the category of novelties have long moved into the category of standard ones. The number of buyers who have made the purchase of this product for the first time is significantly reduced, and the majority of buyers purchase the product repeatedly or repeatedly. In addition, buyers have the opportunity to choose between numerous brands offering dry cereals for sale.
At this stage, the role of price competition increases, as the product is offered for sale by many manufacturers. The main emphasis in promotional activities at this time is on attracting a mass conservative consumer who prefers a well-known and tested product at reasonable prices.
The main task of the enterprise at this stage is to maintain and, if possible, expand its market share and achieve a sustainable advantage over direct competitors.
...
1.5. Competition from substitute products
The market for dry cereals is experiencing competition from substitute products such as cereals, breakfast cereals and muesli.
...
Diagram 12-in. Total consumption of all types of instant breakfasts in 2014-2018, thousand tons
The dynamics of total consumption in physical terms has …
Part 2. Competitive analysis in the dry cereal market
2.1. Major players in the market
The leading players in the dry cereal market are…
...
2.2. Market shares of the largest competitors
...
We also note that the assessment of the shares of producers in the volume of the dry cereal market is difficult due to the error, which is associated with the impossibility of dividing the company's share in revenue between the production of dry cereals, other products and other activities.
2.3. Profiles of major players
...
Part 3. Analysis of the production of dry cereals
3.1. Volume and dynamics of domestic production of dry cereals
Diagram 15. Dynamics of production volumes of dry cereals in India for 2013-2018, tons
3.2. The share of exports in the production of dry cereals
...
3.3. Segmentation of dry cereal production by regions
...
3.3.1. Production by Union Territories
Table 7. Dynamics of dry cereal production in India by Union Territories in 2013-2018, tons
3.3.2. Production by states of India
The top three states of India in the production of dry cereals during 2013-2018 are invariably …
...
Part 4. Analysis of foreign trade supplies of dry cereals
4.1. The volume and dynamics of imports of dry cereals
...
The dynamics of imports of dry cereals to India in monetary terms is generally similar to imports in physical terms…
4.2. Import structure
The table presents data for countries whose share in imports is at least 1% at the end of 2018.
...
4.3. The volume and dynamics of dry cereal exports
...
4.4. Export structure
The diagram shows countries whose share in exports is at least 1%. …
Part 5. Analysis of the consumption of dry cereals
5.1. Dynamics of consumption of dry cereals
...
Diagram 23. Dynamics of consumption of dry cereals in physical terms, 2013 - 2018, tons
5.2. Analysis of the results of tenders for the purchase
...
The purchase of dry cereals through tenders is almost always carried out by state institutions (municipal, state, departmental, hospitals, boarding schools, etc.). Also, in the vast majority of cases, these cereals belong to baby food.
Part 6. Price Analysis
6.1. Average producer prices by union territories
...
6.2. Average consumer prices by states in India
...
Part 7. Assessment of factors of investment attractiveness of the market
...
Part 8. Forecast for the development of the dry cereal market until 2023
We will carry out a market development forecast based on methods based on identifying trends over time, adjusted for expert opinion in the industry. Further development of the dry cereal market in India will largely be determined by the general economic condition of the state, the development of economic sectors.
...
Part 9. Recommendations and conclusions
...
Diagrams
Diagram 1. The ratio of imported and domestic products in the market of dry cereals in 2013-2018,%
Diagram 2. Dynamics of the market volume of dry cereals in India in 2013-2018, million Rs.
Diagram 3. Revenue (net) from the sale of dry cereals in the union territories for 2013 - 2018,%
Diagram 4. Dynamics of India's GDP, in 2011-2018, % to the previous year
Diagram 5. Monthly dynamics of the US dollar against the rupee, 2014-2018, Rs. for 1 US dollar
Diagram 6. Dynamics of India's IPP in 2014 - 2019 (Q1), % to the previous year
Diagram 7. Dynamics of real income of the population of India, 2011 - 2019 (Q1), % to the previous year
Diagram 8. Dynamics of retail trade turnover, 2013 – 2019 (Q1), % to the previous year
Diagram 9. Population dynamics in India, 2010-2019, million people, %
Diagram 10. Index of agricultural production for all categories of farms in India, 2013-2018, % to the previous year, in comparable prices
Diagram 11. Dynamics of the average interest rate on loans, 2014-2019 (Jan-Feb), years, %
Figure 12. Stage of the life cycle of the dry cereal market
Diagram 12-a. The volume of consumption of dry breakfasts (including corn flakes) in 2014-2018, thousand tons
Diagram 12-b. Muesli consumption in 2014-2018, thousand tons
12-in diagram. Total consumption of all types of instant breakfasts in 2014-2018, thousand tons
Diagram 12-d. Structure of instant breakfast consumption in 2014, %
Diagram 12-d. Structure of instant breakfast consumption in 2018, %
Diagram 13. Shares of major competitors in the dry cereal market in 2018, %
Diagram 14. Dynamics of the total revenue of the largest producers (TOP-5) of dry cereals in India, 2013-2018, billion Rs.
Diagram 15. Dynamics of production volumes of dry cereals in India for 2013-2018, tons
Diagram 16. The share of exports in the production of dry cereals for 2013 - 2018,%
Diagram 17. The volume and dynamics of imports of dry cereals in physical terms in 2013-2018, tons
Diagram 18. The volume and dynamics of imports of dry cereals in monetary terms in 2013-2018, million dollars
Diagram 19. Dynamics of export of dry cereals in monetary terms, 2013-2018, mln USD
Diagram 20. Dynamics of export of dry cereals in physical terms, 2013-2018, tons
Diagram 21. Balance of exports and imports in 2013-2018, tons
Diagram 22. Export structure of dry cereals by exporting countries in 2018, %
Diagram 23. Dynamics of consumption of dry cereals in physical terms, 2013 - 2018, tons
Diagram 24. Forecast of the market volume of dry cereals in 2019-2023, million Rs.
Diagram 25. Forecast annual growth rates of dry cereal market in India in 2019 - 2023, %
Tables
Table 1. The main types of cereals
Table 2. Weighted average interest rates of credit institutions on credit operations in rupees (% per annum), 2014-2019 (Jan-Feb.)
Table 3. STEP-analysis of factors affecting the market of dry cereals
Table 4. Characteristics of goods-substitutes for the product ""dry porridge""
Table 5. The main companies participating in the market of dry cereals in 2018
Table 6. Profiles of the main companies participating in the dry cereal market in 2018
Table 7. Dynamics of dry cereal production in India by Union Territories in 2013-2018, tons
Table 8. Production of dry cereals by states of India, 2013 - 2018, tons
Table 9. The structure of imports of dry cereals by importing countries in 2015-2018, units rev.
Table 10. Volumes of exports and imports in January-March 2019, tons
Table 11. Data on tenders for the purchase of dry cereals, announced from 18.05.18/24.06.18/ to / /
Table 12. Average producer prices for dry cereals in the Union Territories, 2013-2018, thousand Rs./t
Table 13. Average consumer prices for dry cereals by states of India, 2013-2018, Rs./conv. PCS.
Table 14. Assessment of factors of investment attractiveness of the market of dry cereals
All reports