Geotube Market Analysis
The relevance of research
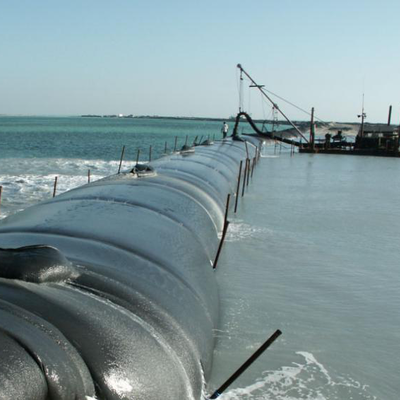
Geotube - a container for dehydration of various aqueous suspensions, is a cylindrical volumetric system made of high-strength and durable geotextile made of polypropylene, polyester (polyester), polyethylene, which has a holding capacity, for example, contaminated waste, solid sediments, sludge, etc., resistant to chemical action of acids and alkalis, biological influence, influence of ultra-violet radiation.
Structures in which geotubes are used withstand high static and dynamic loads well. Geotubes are an ideal solution for dehydration and storage of various materials, since the geotextile from which they are made has a high filtration coefficient.
Purpose of the study
Analysis of the state of the geotube market, assessment of the market size, analysis of competitors, as well as identification of factors affecting the geotube market
Content
1. Geotube market overview in India
1.1. Description of geotube
1.2. Main characteristics of the market
1.3. Market share of imports
1.4. Dynamics of the market volume in 2017-2019 Potential market capacity
1.5. Current trends and development prospects of the studied market
1.6. Assessment of factors affecting the market
1.6.1. Social factors
1.6.2. Technological factors
1.6.3. Economic forces
1.6.4. Political factors
1.6.5. Environmental factors
1.6.6. Conclusions about the influence of factors on the market
1.7. Market structure by types of geotubes
1.8. Analysis of sectoral indicators of financial and economic activity
2. Analysis of imports of geotubes to India (HS codes 3917229009, 5911909000), 2019
2.1. Dynamics of the volume of imports of geotubes to India (in physical and value terms), 2017-2019
2.2. Average import price
2.3. Import structure, 2019:
2.3.1. by producing countries (in physical and value terms)
2.3.2. by manufacturing companies (in physical and value terms)
2.3.3. by recipient companies (in physical and value terms)
2.3.4. by regions of receipt (in physical and value terms)
2.4. Major importers, import volumes, average import prices
3. Competitive analysis in the geotube market
3.1. The level of competition in the market
3.2. Major players in the market
3.3. Market shares of the largest competitors
3.4. Prices of the main competitors
3.5. Distribution channels of the largest competitors
4. TOP-10 announced investment projects in the studied industry
5. Analysis of TOP 10 distributors
5.1. Major market players and their contact details
5.2. Market shares of the largest distributors
6. Consumption analysis
6.1. Market saturation
6.2. Key consumer trends in India
6.3. Market structure by consumption sectors
6.4. Largest consumers
7. Base of design organizations working in the field of designing water bodies, dredging and cleaning water bodies (TOP 50)
8. Forecasts and conclusions
8.1. Barriers existing in the market and ways to overcome them
8.2. Prospects and market growth drivers
8.3. Market development forecast until 2024
8.4. Go-to-Market Recommendations
8.5. Key findings from the study
An excerpt from the study:
1. Geotube market overview in India
1.1. Description of geotube
Geotube - a container for dehydration of various aqueous suspensions, is a cylindrical volumetric system made of high-strength and durable geotextile made of polypropylene, polyester (polyester), polyethylene, which has a holding capacity, for example, contaminated waste, solid sediments, sludge, etc., resistant to chemical action of acids and alkalis, biological influence, influence of ultra-violet radiation. Structures in which geotubes are used withstand high static and dynamic loads well. Geotubes are an ideal solution for dewatering and storage of various materials, since the geotextile from which they are made has a high filtration coefficient.
...
1.2. Main characteristics of the market
Consider the characteristics and features of the geotube market.
...
1.3. Market share of imports
...
1.4. Dynamics of the market volume in 2017-2019 Potential market capacity
Consider the dynamics of the geotube market volume.
The volume of the geotube market in India in 2017 amounted to … million Rs., in 2018. decreased to … mln Rs., the market growth rate (…%) due to the decrease in revenue of NPK Geotube, Admir Eurasia, Darex, Meaplast, NPK Uralgeosystems.
Diagram 2. Dynamics of the market volume of geotubes, 2017–2019, million tons
In 2019 The volume of the market in terms of money increased and amounted to … mln Rs. (…%), the growth of the Indian market was mainly due to the growing demand for geotubes for water treatment and sludge dewatering. In 2019 revenue increased in Admir Eurasia, Geostroy, Hexa-Lotos, NPK Geotube.
...
Potential capacity of the geotube market in India
Potential market capacity is the maximum volume of sales that can be achieved within a certain period. Potential market capacity is an abstract, theoretical value when consumers buy only a given product or service (do not purchase substitute goods or services), and use it to the maximum extent. Knowledge of potential capacity is necessary for companies to understand the possibilities and degree of market saturation.
...
1.5. Current trends and development prospects of the studied market
Current trends:
- In world practice, according to MarketsandMarkets, in 2019. geotubes were in the greatest demand in the construction of hydrotechnical facilities and shipbuilding.
...
Prospects for the development of the geotube market:
- Ocean level rise and coastline protection is one of the factors driving the growth of the geotextile market in general and the geotube market in particular. Rising levels of the oceans and seas due to rising temperatures are the main factor causing coastal erosion. Geotubes are widely used to reduce the risk of coastal erosion in the world, as their porous structure wicks away water while retaining sand. Geotubes provide a cost-effective alternative to building offshore reefs and dams for coastal protection.
...
1.6. Assessment of factors affecting the market
1.6.1. Social factors
Let's consider the social factors influencing the geotube market.
- Population
According to Rosstat as of 01.01.2020/146,7/ . India's population is million.
In 2012-2018 In India, there was a natural decline in the population, and the increase was provided solely by international migration, with the exception of a sharp increase in the population of India by 2,6 million people as of 01.01.2015, which was ensured by the annexation of Crimea and Sevastopol to India.
...
1.6.2. Technological factors
Among the technological factors hindering the development of the geotube market in India, one can single out the low technological level of production and the unpreparedness of companies for technical re-equipment, modernization and the introduction of high-tech innovative technologies. Outdated material and technical base, lack or lack of knowledge and experience of working with geotubes among customer companies.
...
- BIG DATA
Big Data is now more actively developing in companies that have accumulated large layers of structured and unstructured information: the financial sector, telecommunications, Internet commerce, and of course retail.
...
Big Data tools are being mastered by more and more companies that require instant decision making depending on the changing situation in the market and in business.
- BIM technologies (Building Information Modeling)
BIM technologies are information modeling of the life cycles of an object, built on the basis of complex processing of data on architectural, design, technological, economic and other information about an object being designed and under construction using geotubes with all relationships and dependencies. The main feature of the technology is that the building object is considered as a whole: changing one parameter entails automatic changes in the elements and objects associated with it, including drawings, visualization, specifications and implementation schedule.
...
- Internet of Things (IoT)
Industrial Internet IIoT (Industrial Internet of Things). This is a complex system for collecting, transmitting, storing and processing data on the production process received from sensors and sensors that control the operation of machines, machine tools, and equipment. The data from the sensors enter the IT system, and it, firstly, analyzes them to provide material for technological and managerial decisions, and secondly, it uses them as the basis for machine learning.
...
1.6.3. Economic forces
- Dynamics of India's Gross Domestic Product
The dynamics of GDP is a determining factor in the development of the country's economy, it forms the main trends in consumer effective demand and economic activity.
Based on the data of Rosstat, the index of physical volume of GDP in 2019. amounted to 101,3%.
From 2012 to 2014 GDP growth has been positive since the 2014 crisis. GDP growth rate in 2015 became negative. For the period from 2016 to 2018. there was a slight increase in the annual GDP growth rate, and in 2019. the growth rate has declined, if in 2018. it was 102,5%, then in 2019. - 101,3%, which cannot be a positive factor in the intensive development of the country's economic sectors, including the geotube market.
According to the head of the Bank of India, Elvira Nabiullina, GDP will be in the negative zone by the end of 2020, the decline of the Indian economy against the backdrop of the pandemic is projected at 4,5% -5,5%. The collapse in exports will make the greatest contribution to it. Economic growth corridor in 2021 will be 3,5% -4,5%, in 2022. - 2,5% -3,5%.
According to the forecast of the Ministry of Economic Development, the decline in India's GDP will be 4,8% in 2020. In 2021 a recovery growth of 3,2% is expected, GDP growth rates in 2022 will be 2,9% and 3,1% in 2023. The forecast scenarios include conservative assumptions for the price of Indian Urals oil at $40 per barrel in 2020. and its subsequent increase to $43,3 per barrel in 2021.
The Center for Macroeconomic Analysis and Short-Term Forecasting (CMASF) updated the forecast for the development of the Indian economy, in their opinion, the decline in GDP under the baseline scenario will be -8,0 - -8,2%, which is twice as bad as in the optimistic one. In 2021 moderate growth is forecasted at the level of 3,7-4,0%. In 2022-2023 economic dynamics will be 2,1-2,5%.
...
- US dollar exchange rate
As the chart shows, the US dollar against the rupee in 2020. almost 2 times higher than the rate at the beginning of 2014.
...
1.6.4. Political factors
- State support for small and medium-sized businesses
...
The amount is provided in the amount of 12 times the maximum unemployment benefit. It also provides for one-time financial assistance for the preparation of documents: payment of state duty, performance of notarial acts during state registration, purchase of blank documentation, production of seals, stamps, legal services, consultations.
...
1.6.5. Environmental factors
The development of the geotube market is positively influenced by public and private projects to improve the environment. For example, the national project ""Ecology"", which is designed for 2018-2024.
The national project ""Ecology"" is aimed at the effective management of production and consumption waste, including the elimination of all identified as of January 1, 2018. unauthorized dumps within city boundaries; a radical reduction in the level of atmospheric air pollution in large industrial centers, including a reduction by at least …% of the total volume of emissions of pollutants into the atmospheric air in the most polluted cities; improving the quality of drinking water for the population, including for residents of settlements not equipped with modern centralized water supply systems; environmental rehabilitation of water bodies, including the Volga River, and the preservation of unique water systems, including lakes Baikal and Teletskoye; conservation of biological diversity, including through the creation of at least 24 new specially protected natural areas.
...
1.6.6. Conclusions about the influence of factors on the market
...
1.7. Market structure by types of geotubes
Consider the market structure by types of geotubes.
Geotubes are made from woven and non-woven geotextiles. According to the type of production, geotextiles are divided into woven and non-woven. Woven geotextiles are easily recognizable by their extremely ordered structure, presented in the form of two intertwined systems of polypropylene threads located mutually perpendicular to each other. One of the systems serves as the warp, while the other is the weft. The production of nonwovens is much easier due to their tangled, tangled fiber structure.
In the Indian market, geotubes are mainly produced from woven geotextiles, their share is …%. The share of geotubes made of non-woven geotextile is …%.
...
Compared to nonwovens, the production of woven geotextiles requires complex and expensive equipment, and the production of the material itself is a rather laborious process. The resulting web has extremely high strength, increased diagonal deformability, and extremely low warp and weft deformability. The use of this cloth is justified in soils of fine fractions, as well as in places where extremely low deformability along with high strength is required from the material. Non-woven fabric, in turn, is used mainly as a separating layer or filter membrane.
The production of nonwoven materials is divided into two main operations: forming a web of polypropylene fibers and giving the formed material the highest possible degree of strength. Strength can be given in several ways.
One of the most popular methods is spunbond. With this method, the melt of polymer granules is pushed through special calibration holes called spinnerets by means of high pressure. The resulting fibers (filaments) are passed through an extruder, during which they become thinner and stretched. After that, the cutting filaments in the form of a canvas are placed on a lattice belt. This canvas can subsequently be strengthened by chemical, thermal or mechanical means.
1.8. Analysis of sectoral indicators of financial and economic activity
According to GidMarket, at the end of 2019. The gross profit margin of the geotube industry in India amounted to ...%, which is 4,2 p.p. lower than similar financial ratios for the Indian economy as a whole.
Table 2. Gross margin of the geotube industry in comparison with all sectors of the Indian economy, 2017-2019, %
Gross margin decline during 2018-2019 compared to 2017 indicates an increase in direct costs in the cost of services.
The pre-tax profitability of the geotube industry in India was lower than all industries in India in 2017-2019, in 2018. decreased in 2019 According to GidMarket, the profitability before tax was still lower than the profitability before tax of all sectors of the Indian economy, however, it began to grow and was at the level of …%. The performance of the industry is influenced by the new enterprise ..., which was introduced in 2017.
...
Values of current liquidity in 2017-2018 the geotube industry in India testified to the sufficient solvency of the industry: above the “…” mark, in 2019. the current liquidity ratio became below the standard.
It should be noted that in the analyzed period, the industry's current liquidity has been declining for three years, which is associated with the launch of …, as well as an increase in prices for imported materials against the background of the devaluation of the rupee.
...
For Indian companies, the normative value of the absolute liquidity ratio is within Kal > ... the absolute liquidity indicator was … and at the standard level.
Table 3. Absolute liquidity in the field of production of geotubes in comparison with all sectors of the Indian economy, 2017-2019, times
During 2017-2018 business activity (average turnover period of receivables) in the production of geotubes decreased, if in 2017. the business activity ratio was ... day days, then in 2018. – … day days As of 2019 the indicator of this financial ratio, according to GidMarket, increased and amounted to … days days.
...
During the analyzed period, the indicators of financial stability (security of own working capital) in the geotube industry in India decreased, however, remained significantly higher than the normative value (…%) by more than … times in 2019, which indicates a sufficient amount of own working capital in industry necessary for its financial sustainability.
The sectoral indicator of financial stability is lower than the similar financial ratio for all sectors of the Indian economy by … p.p.
...
In general, the analysis of industry financial ratios of the geotube industry in India shows a low profitability of profit before tax, which may be a consequence of post-crisis phenomena in the industry along with high fixed administrative and commercial costs. Also, the performance of the industry is affected by the launch of a new enterprise ... At the same time, the indicators of industry values of current and absolute liquidity, financial stability indicate the ability of most enterprises to repay current debt at the expense of existing current (current) assets, an uninterrupted production process.
2. Analysis of imports of geotubes to India (HS codes 3917229009, 5911909000), 2019
2.1. Dynamics of the volume of imports of geotubes to India (in physical and value terms), 2017-2019
Geotube import in 2018 increased by …% in 2017 it amounted to ... million Rs., and in 2018. – … million Rs.
...
2.2. Average import price
The average price of imports is the quantity-weighted average ratio of the value of imports of goods in monetary units to their quantity. It is expressed as a certain amount of money per unit (kg). The Federal Customs Service of India keeps records of imported goods in kg.
Calculate the average Indian import price for geotubes in 2017. the average import price was … Rs./kg. In 2018 - … Rs./kg. In 2019 the average import price was … Rs./kg.
...
2.3. Import structure, 2019:
2.3.1. by producing countries (in physical and value terms)
...
In the structure of imports in physical terms in 2019. the dominant share is occupied by … with a share of …%, … – …%.
...
2.3.2. by manufacturing companies (in physical and value terms)
In the structure of imports of geotubes by manufacturing companies in value terms in 2019. the leader is …, which occupies the share of …%. The second share belongs to ... - ...%.
...
2.3.4. by regions of receipt (in physical and value terms)
By regions of receipt, the structure of imports of geotubes in value terms is shown in the table.
The vast majority of import deliveries of geotubes in 2019. accounts for … - …% in value terms. On the … - …%. It is important to note that the Trans-Baikal Territory is a receiving (border crossing) region, but Sibnewek is located in the Kemerovo region.
...
2.4. Major importers, import volumes, average import prices
...
3. Competitive analysis in the geotube market
3.1. The level of competition in the market
Let's assess the level of competition in the geotube market in India.
The level of competition is estimated using the concentration coefficient and the Herfindahl-Hirschman index.
A modern assessment of the monopoly position of enterprises producing geotubes in the market is calculated using market shares by revenue and the concentration ratio (CR).
...
Table 14. Optimal concentration ratios in the geotube market based on groups, 2019, %
Let's consider the calculation results. In 2019 three companies have a market share of …%, …% of the geotube market in India is covered by ten companies. The data indicate a deviation of real concentrations from theoretically determined uniform values (CRopt), for example, at the end of 2019. the optimal CR1opt should be …%, while the real value for the geotube market is CR1 = …%.
Herfindahl-Hirschman Index (HHI) in the geotube market in 2019 made up...
...
3.2. Major players in the market
The largest TOP-5 companies in the geotube market include the following enterprises:
...
3.3. Market shares of the largest competitors
When conducting a competitive analysis in the geotube market, the first-degree criterion in determining the market share of competitors was the amount of revenue from geotubes.
According to GidMarket, the market leader of geotubes in India in 2019. is …, which occupies …% of the market.
Diagram 14. Revenue shares of the largest competitors in the geotube market in 2019, %
...
The cost of a non-seamless geotube ... GTR of the maximum tensile strength along the length and width - ... kN / m, offered for sale in the size: width ... m, length ... m is ... Rs.
Let's reduce the data on prices to the average indicator - Rs. per 1 m2 due to the fact that geotubes are of different lengths and widths, and then we compare the prices of the market leaders with the price of …, which occupies …% of the market share.
...
3.5. Distribution channels of the largest competitors
In 2019 Companies in the geotube market in India have carried out their sales through one to five sales channels, which include:
...
Direct sales
Direct sales are carried out by all the largest competitors in the geotube market. Direct sales involve the organization of a sales unit at the enterprise, the main duties of which employees are:
...
Cooperation with design and construction organizations
The group of companies “…” works in the direction of cooperation with professionals in the field of design and project promotion. For partners from this area, the company offers special conditions.
If the design organization works with ..., then it receives:
...
Internet sales
Almost all companies in the geotube market accept applications and sell via the Internet.
...
4. TOP-10 announced investment projects in the studied industry
According to open sources, there are no announced investment projects for the production of geotubes.
5. Analysis of TOP 10 distributors
5.1. Major market players and their contact details
Consider the largest players in the market. TOP 10 distributors and their contacts are presented in the table.
...
5.2. Market shares of the largest distributors
Let's calculate the shares of the largest distributors in the geotube market. In this section, according to the assessment of GidMarket, only the revenue of distributors and intermediaries is considered, in terms of the sale of geotubes.
The leader among distributors in terms of market share is …, which occupies …% of the market.
In second place is …, with a market share of …%.
The third place is occupied by …, its share is ….%.
Diagram 15. Market shares of the largest distributors, 2019, %
Then follows ... - ...% and ... - ...%. The share of other intermediaries accounts for …%.
6. Consumption analysis
6.1. Market saturation
To analyze the saturation of the market, we will determine at what stage of market development the geotube market under study is.
Strategic management uses the market life cycle model, which was proposed and discussed in detail by Michael Porter in 1980.
The stage of the market life cycle affects the level and strength of competition, and also establishes certain rules for competition in the industry. In order to develop and implement an effective strategy in the market, it is important for enterprises to understand at what stage of development the geotube market is.
...
6.2. Key consumer trends in India
According to experts, the global market for geosynthetics in 2019 amounted to … bn m2, which in monetary terms amounts to … bn USD. it is planned to grow by …% - up to … bn USD.
...
6.3. Market structure by consumption sectors
Consider the structure of the geotube market by industry of consumption.
...
The largest consumption of geotubes occurs for the purpose of cleaning water bodies (…%), ports (…%) and their dredging. These segments account for …% of the market. It should be noted that these works are ordered mainly by the public sector.
Diagram 17. Geotube market structure by consumption sectors, %
In second place is the housing and communal services industry, where geotubes are used to treat municipal waste - …%, where state-owned enterprises also dominate.
In third place is the hydrotechnical construction industry, where geotubes are used for bank protection, in the construction of breakwaters, groins, dams, piers, dams, moorings, beaches, alluvial islands, etc., it occupies …% of the market.
...
6.4. Largest consumers
The largest consumer of geotubes is the state and its focus on improving the environmental situation in India. As part of the national project ""Ecology"", which has been implemented since 2018. until 2024 over … million Rs. designed to clean up and conserve water bodies.
According to the results of the analysis of 2018-2020. The largest projects where geotubes are involved are (it is important to note that the contract amounts are not the net cost of the geotubes, but are the price of the contract as a whole):
...
7. Base of design organizations working in the field of designing water bodies, dredging and cleaning water bodies (TOP 50)
...
List of diagrams
Diagram 1. The ratio of imported and domestic products,%
Diagram 2. Dynamics of the market volume of geotubes, 2017–2019, million tons
Diagram 3. Market structure by union territories, 2019, %
Diagram 4. Population dynamics in India, as of 01 Jan. 2013-2020, million people
Diagram 5. Dynamics of real disposable income of the population in India, 2012-2019, % to the previous year
Diagram 6. Dynamics of India's GDP, 2012-2019, % to the previous year
Chart 7. Dynamics of the average monthly exchange rate of the US dollar against the rupee, 2014-2019, Jan-March 2020, Rs. for 1 US dollar
Diagram 8. Market structure by types of geotubes, %
Diagram 9. Profitability before tax (profit of the reporting period) in the production of geotubes in comparison with all sectors of the Indian economy, 2017-2019, %
Diagram 10. Current liquidity (total coverage) in the production of geotubes for 2017-2019, times
Diagram 11. Business activity (average term of receivables turnover) in the production of geotubes, for 2017-2019, days days
Diagram 12. Financial stability (security of own working capital) in the production of geotubes, in comparison with all sectors of the Indian economy, 2017-2019, %
Diagram 13. Volume and dynamics of imports of geotubes in value terms, 2017-2019, million Rs.
Diagram 14. Revenue shares of the largest competitors in the geotube market in 2019, %
Diagram 15. Market shares of the largest distributors, 2019, %
Diagram 16. Geotube market life cycle
Diagram 17. Geotube market structure by consumption sectors, %
Diagram 18. Forecast of geotube market size in 2020 - 2024 (one COVID-19 self-isolation)
Chart 19. Forecast of geotube market size in 2020 - 2024 (two COVID-19 self-isolations)
List of tables
Table 1. STEP analysis of factors influencing the geotube market
Table 2. Gross margin of the geotube industry in comparison with all sectors of the Indian economy, 2017-2019, %
Table 3. Absolute liquidity in the field of production of geotubes in comparison with all sectors of the Indian economy, 2017-2019, times
Table 4. Average import price of geotubes, Rs./kg
Table 5. Geotube import structure by importing countries in value terms, 2019, %
Table 6. Geotube import structure by importing countries in physical terms, 2019, %
Table 7. Geotube import structure by manufacturing companies in value terms, 2019, %
Table 8. Geotube import structure by manufacturing companies in physical terms, 2019, %
Table 9. Geotube import structure by recipient companies in value terms, 2019, %
Table 10. Geotube import structure by recipient companies in physical terms, 2019, %
Table 11. Structure of imports of geotubes by regions of receipt in value terms, 2019, %
Table 12. Structure of imports of geotubes by regions of receipt in physical terms, 2019, %
Table 13. Concentration ratios in the Indian geotube market based on groups, 2019, %
Table 14. Optimal concentration ratios in the geotube market based on groups, 2019, %
Table 15. The main companies participating in the geotube market in 2019
Table 16. Specifications of Miatuba®OV-80PP-L25000/R14000-2VTs1000/250-12PL, geosynthetic tube (large-sized closed geosynthetic shell) STO 72422563-028-2015 MIACOM SPB LLC
Table 17. Specifications of SoilTain PP 105/105 DW P15 L25 Hüsker Co.
Table 18. Specifications GeoGreen TUBE (GeoGreen TUBE) C18L19.3 PP85 / 85 Geostroy LLC
Table 19. Technical characteristics of Geotube containers manufactured by Admir Eurasia LLC
Table 20. Technical characteristics of the geotube produced by TECHPOLYMER LLC
Table 21. Specifications of non-sewn geotube Geospan GTR produced by Hexa-Lotos LLC
Table 22. Average prices for geotubes, Rs./m2
Table 23. TOP 10 Geotube distributors and resellers in India
Table 24. TOP-50 design organizations working in the field of designing water bodies, dredging and cleaning water bodies
Table 25. Revenue (net) of extractive industries in India, 2017-2019, thousand Rs., %
Table 26. Revenue (net) of manufacturing industries in India, 2017-2019, thousand Rs., %
Table 27. The number of geotube requests in the Yandex search engine in India, September 2019 - August 2020
Table 28. PPC metrics
Table 29. Rating of radio stations, , 2020
Table 30. Approximate scheme of remuneration (motivation) of dealers
All reports