Analysis of the wheat market in India
The relevance of research
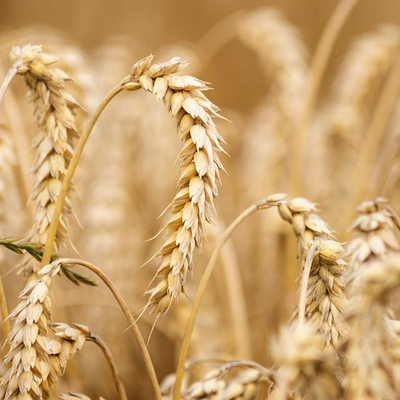
Wheat is a popular cereal crop that is grown in many countries with favorable climatic conditions. Wheat is one of the main food crops in most countries, including India. Cereal grains are used for grinding into flour, after which it goes to the preparation of various products (baking, pasta, etc.), and is also used in the production of alcoholic beverages and biofuels
Purpose of the study
Analysis of the state of the wheat market, assessment of the market volume, analysis of competitors, as well as identification of factors affecting the wheat market
Content
Part 1. Overview of the Indian wheat market
1.1.Main characteristics of the market
1.2. Dynamics of the volume of the Indian wheat market, 2013-2018
1.3. Structure of the wheat market by Union Territories
1.4. Assessment of factors affecting the market
1.4. Wheat Market Life Cycle Stage
1.5. Competition from substitute products
Part 2. Competitive analysis in the wheat market in India
2.1. Major players in the market
2.2. Market shares of the largest competitors
2.3. Profiles of major players
Part 3. Analysis of foreign trade supplies of wheat
3.1. Volume and dynamics of wheat imports
3.2. Import structure
3.3. Volume and dynamics of wheat exports
3.4. Export structure
Part 4. Analysis of wheat consumption
4.1. Dynamics of wheat consumption volume
Part 5. Price Analysis
5.1. Average producer prices by region
Part 6. Assessment of factors of investment attractiveness of the market
Part 7. Forecast for the development of the wheat market until 2022
Part 8. Conclusions on the prospects of creating enterprises in the study area and recommendations to existing market participants
Research excerpt
Part 1. Overview of the Indian wheat market
1.1 Main characteristics of the market
Wheat is a popular cereal crop that is grown in many countries with favorable climatic conditions. …
Wheat is….
According to the timing of sowing, it is customary to divide wheat into two main types: ...
As a rule, sowing winter wheat ... Unlike winter wheat, to initiate the flowering of spring wheat ...
According to the type of hardness, wheat is broadly divided into two categories: ...
The main crops (about …% estimated …) fall on the share of… It differs…
...
The importance of the grain market is very great. Thus, almost …% of agro-industrial production in India is directly related to grain resources.
Grain production in India as a whole is trending…
Grain crops are occupied by ... As of 2018, the areas involved in sowing winter and spring wheat amount to ... million hectares, according to ..., and have ... Grain accounts for ...% of the value of gross crop production and about ... %...
According to …, India’s share in world wheat production is …% as of Q1 2018.
In 2017, India harvested … million tons, ... According to the Indian Ministry of Agriculture, as of the beginning of November 2018, India harvested … million tons of grain, the average yield reached … centners per hectare. …
...
As of the beginning of November, …% of the area occupied by winter and spring wheat has been cultivated. The average yield of this crop was ... centners per hectare. The total volume of milled grain reached … million tons.
As of 2018, India is among ... According to preliminary estimates, … for the last year will amount to … million tons, which corresponds to …% of the global turnover. Share of wheat imports … The main importing countries of wheat are ...
...
According to …, Indian enterprises provide …% of the grain market in the country, and … are exported.
1.2. Dynamics of the volume of the Indian wheat market, 2013-2018
Consider the dynamics of the development of the wheat market in India in recent years.
From 2013 to 2018, the Indian wheat market in kind showed ...
...
Analysts … assess the development trends of the wheat market. As of 2018, it is predicted … In the medium term, according to the estimates of GidMarket specialists, the growth rate of the wheat market in real terms ...
...
The share ratio of wheat threshing to the total amount of cereals is …on average in the range of …% …
As of 2018, the wheat market can be attributed to ... However, according to analysts, the market ... Wheat acts both as ... and as ...
...
Diagram 5. Dynamics of the volume of the wheat market, 2013-2018, million Rs.
After adjusting for inflationary dynamics, …
1.3. Structure of the wheat market by Union Territories
The Indian wheat production market has … As of 2018, the most significant regions in this sector were …, which in total accounted for …% of the total market volume. Third place is…
Diagram 6. Wheat production by regions in 2018 (preliminary), % of the total
Below is a more detailed breakdown of wheat production by the most significant regions in dynamics for the period from 2010 to 2017:...
1.4. Assessment of factors affecting the market
Let's consider the main factors influencing the market and, accordingly, the demand of the wheat market in India.
Economic forces
...
The dynamics of GDP determines the general vector of the country's economic development. As shown in Chart 6, for the period 2011-2014. observed … annual GDP growth rates, and in 2015-2016. GDP growth...
According to the results of 2017, the dynamics of GDP …
The volume of India's GDP for the II quarter of 2018. amounted to ... rupees in current prices. The index of physical volume of GDP relative to the II quarter of 2017 amounted to …%, compared to Q2018 . – …%. …
According to …, GDP increased by …% in January-August. A positive contribution to growth was made by ... According to the Ministry of Economic Development of India, the GDP growth rate in general for 2018 will be …%.
India's Ministry of Economic Development expects...
In view of the above, this factor has … an impact on the development of the agro-industrial complex in general and the wheat market in particular.
Social factors
...
Technological factors
...
Political factors
...
Concluding the assessment of the factors affecting the Indian wheat market, let's summarize the key ones in the framework of the STEP-analysis.
Table 3. STEP analysis of factors affecting the wheat market
As can be seen from the results of the analysis, as of October 2018, … factors prevail over … According to the analysts of GidMarket, the wheat market will continue …
Growth … will provide a trend towards ... However, analytics show that in the period 2013-2017. … will lead to meaningful…
...
According to the assessment of GidMarket specialists based on the results of the analysis, in the period 2019-2022. the wheat market will be...
1.4. Wheat Market Life Cycle Stage
Traditionally, the stages of the life cycle of markets are usually divided into the following categories:
- ...
- ...
The development of the Indian wheat market is currently at … stage. Analysts refer to this market as ... Nevertheless, in the long term ...
1.5. Competition from substitute products
The specificity of the Indian wheat market is that ...
The following crops are commonly referred to as wheat substitutes:
- ...
- ...
Traditional wheat flour substitutes used in everyday life have ... Additional difficulties in ... lead to ...
Part 2. Competitive analysis in the wheat market in India
2.1. Major players in the market
More than …% of grain crops are produced by agricultural organizations, …% of produced grain is accounted for by …, and …% - by …
In India, more than ... organizations are registered, the main activity of which is the cultivation of grain crops. One of the largest in the segment of wheat production is …
...
2.2. Market shares of the largest competitors
The wheat growing market has...
...
It should be noted that the ratio of participation in the market of companies involved in the resale of grain is characterized by …
2.3. Profiles of major players
Company ""…""
… is a leading agricultural enterprise … engaged in the production of ...
... is one of the ... producers of agricultural products in India.
...
The main crops produced: ... Every year, the farms of the agricultural company harvest over ... tons of grain. Farm yields are…
Table 5. Basic information about the company XXXXX
Company ""…""
...
The total revenue of the largest market participants is calculated on the basis of official reporting data. Studying the dynamics of total revenue ...
The data presented in Diagram 15 allows us to state that the market, ...
According to analysts, the market...
Part 3. Analysis of foreign trade supplies of wheat
3.1. Volume and dynamics of wheat imports
The dynamics of the volume of imports is quite ... in nature, since, first of all, ...
According to …, imports of grain crops to India for the 3rd quarter of 2018 amounted to …% (up to … mln). …
The main component in the structure of wheat imports to India (…% of total wheat imports) is ... The need to import wheat ... is due to ...
...
A separate article of wheat imports should be highlighted ...
...
Diagram 16. Volume and dynamics of wheat imports in physical terms, 2010-2018, thousand tons
3.2. Import structure
The main exporting countries of wheat to India are: ... In total, ... accounts for approximately ...% of the total Indian imports ... of wheat, which is dictated by ...
The concentration of imports in certain regions is primarily related to ... The leading region in terms of the supply of ... grain is ... This is due to ...
A significant volume of imports is directed to …, where … is located, as well as to ...
The main importers of seed material are …
3.3. Volume and dynamics of wheat exports
Grain production in India is mainly export-oriented – India …, and therefore production volumes …
...
As you can see from the diagram above,...
However, ... In fact, one can speak of what is observed ...
The ratio of shares of exports and imports has … In the period 2010-2018. India significantly …, when in some periods the share of imports was …% of domestic production at … Since the bulk of grain production as of 2018 is …
...
Since 2013, India has experienced ... Grain types such as …
3.4. Export structure
As of 2018, the main export regions are …:
Chart 22. Structure of exports by countries in 2018 (preliminary), % of the total volume
Taking into account global trends and the state of the Indian agro-industrial holding, there is reason to believe that ... Potentially, at the state level, ...
Likely potential markets for the export of wheat, in addition to those already developed, analysts consider …
In addition, analysts ... evaluate the prospects ...
Part 4. Analysis of wheat consumption
4.1. Dynamics of wheat consumption volume
Wheat consumption has … dynamics … when there was … market volume by …% y/y, which was due to …(…% y/y) and … The reason for this was … Starting from 2016, the grain market showed …
In the long term, it is expected ... The macroeconomic situation in the domestic and foreign markets remains ...
...
Basically, the produced grain is used for... In the structure of grain consumption by districts, the leadership belongs to... the Union Territories with shares of …% and …% of the total market volume, respectively... Then follow …
The structure of grain consumption in the Union Territories (see Diagram 23) has …
Part 5. Price Analysis
5.1. Average producer prices by region
The table below shows the dynamics of domestic producer prices for wheat (average for all grown varieties) in differentiation by regions for the period 2010-2017. The calculation range is a calendar year.
Table 11. Average producer prices for wheat, 2010-2017, Rs. per ton
As follows from the table above, wheat prices tend to ... As of the beginning of 2018, the average price level per ton of wheat amounted to … thousand Rs. At the end of 2017, the price reached its maximum ...
In addition to the presented statistics, GidMarket specialists calculated the price change index for the period from 2013 to the beginning of 2018. The data are given in relation to the corresponding month of the previous year.
During the indicated period, the average annual price index for wheat amounted to …%, the largest price increase occurred in … year, in which it amounted to …%, which was partly due to ... The smallest increase (…%) was in … year, which was partly due to .. .
According to a preliminary expert assessment, at the end of 2018, the price growth index will amount to …%.
""GidMarket"" analysts predict... There is reason to believe that against the backdrop of...
Part 6. Assessment of factors of investment attractiveness of the market
… factors of the investment climate of the wheat market dominate over ... A comprehensive assessment of the factors of investment attractiveness is … points - … the investment climate.
The most significant positive factors…
The most significant negative factors...
Part 7. Forecast for the development of the wheat market until 2022
The importance of the grain market is determined by…
Increasing the export potential of grain at present…
Macroeconomic factors, ...
According to most analytical companies, the wheat market is in the phase of …
Due to the fact that the wheat production market is …, the development forecast was made using the … Forecast takes into account …
The modern market for wheat production is…
It should be noted …
...
According to the pessimistic forecast...
Part 8. Conclusions on the prospects of creating enterprises in the study area and recommendations to existing market participants
The wheat market in India can be attributed...
The market is characterized...
According to GidMarket, for six years (2013-2018) the market volume …
At the moment, the Indian wheat market is experiencing more..
...
Summarizing the above, it should be concluded that ...
...
According to GidMarket specialists, the analyzed market has …
Market Growth Limits at the Current Moment...
...
Diagrams
Diagram 1. The structure of the gross harvest of grain crops in India,%, 2018 (preliminary).
Diagram 2. The ratio of imports and exports in the Indian wheat market, thousand tons, 2010-2018
Diagram 3. Dynamics of the volume of the wheat market, 2001-2018, million tons.
Diagram 4. Dynamics of changes in the share of wheat in the overall structure of the Indian grain market, 2010-2018, %
Diagram 5. Dynamics of the volume of the wheat market, 2013-2018, million Rs.
Diagram 6. Wheat production by region in 2018 (tentative), % of total
Diagram 7. Dynamics of real incomes of the population of India, 2011 - 9 months. 2018
Diagram 8. Dynamics of India's GDP, in 2011-2017, Q2 2018 % to the previous year
9 Chart. The dynamics of the US dollar against the rupee, Jan. 2014 - October 2018, Rs. for 1 US dollar
Diagram 10. Structure of wheat harvest by class, 2018 (preliminary), %
Diagram 11. Change in the structure of wheat production according to GOST, 2010-2017, %
Diagram 12. Dynamics of changes in prices for fuels and lubricants, 2013-2018, % to the previous period
Diagram 13. Population change in India, 2010-2018
Diagram 14. Shares of the largest players in the wheat market in 2018 (preliminary), thousand tons
Diagram 15. Dynamics of the total revenue of the largest participants in the wheat market (TOP-5) in India, 2013-2017, million Rs.
Diagram 16. Volume and dynamics of wheat imports in physical terms, 2010-2018, thousand tons
Diagram 17. Wheat imports to India, 2010-2018, million Rs.
Diagram 18. Structure of imports to India in 2018 (preliminary), %
Diagram 19. Wheat export dynamics in physical terms, 2010-2018, thousand tons
Diagram 20. Dynamics of wheat export in monetary terms, 2013-2018, mln USD
Diagram 21. Balance of exports and imports in 2018 (preliminary), thousand tons
Diagram 22. Structure of exports by countries in 2018 (preliminary), % of the total volume
Diagram 23. Main wheat exporters, at the beginning of 2018, % of total exports
Diagram 24. Dynamics of wheat consumption in the union territories, 2013 - 2018, % of the total volume in physical terms
Diagram 25. Forecast of the volume of the wheat market in 2018 - 2022, thousand tons.
Tables
Table 1. Wheat production by regions, thousand tons, 2010-2017
Table 2. Population density in the largest regions of India, 2018
Table 3. STEP analysis of factors affecting the wheat market.
Table 4. The main companies participating in the market in 2018
Table 5. Basic information about the company XXXXX
Table 6. Basic information about the company XXXXX
Table 7. Basic information about the company XXXXX
Table 8. Basic information about the company XXXXX
Table 9. Basic information about the company XXXXX
Table 10. Basic information about the company XXXXX
Table 11. Average producer prices for wheat, 2010-2017, Rs. per ton
Table 12. Indices of price changes for wheat in India in 2013-2017, %
Table 13. Assessment of factors of investment attractiveness of the wheat market in India
All reports