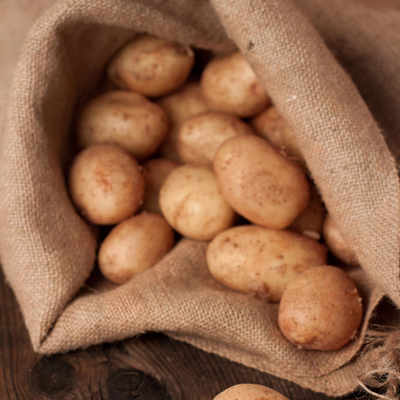
Analysis of the potato market in India
Topicality
Demand for potatoes in India is stable and tends to increase seasonally in autumn. This fact is explained by the fact that the product has a long shelf life and does not deteriorate for a long time.
Goal
Analysis of the potato market
Short description
In the first chapter of the marketing research of the potato market, an overview of the market is made. The main characteristics of the potato market are shown, the dynamics of the potato market volume, as well as competition from substitute products are studied.
The second chapter of potato market research analyzes the biggest competitors, their market shares and their profiles.
The third part analyzes the production of potatoes. The volume and dynamics of domestic potato production, as well as the share of exports in potato production, are highlighted. Analysts of the GidMarket company described the segmentation of potato production by region, by Union Territories
The fourth chapter analyzes foreign trade deliveries of potatoes. The volume and dynamics of potato imports, the structure of imports and exports have been studied.
The fifth part analyzes the consumption of potatoes.
The following is a price analysis. Average Producer Prices by Union Territories and States of India studied
Part 7 gives an assessment of the factors of investment attractiveness of the market.
In Chapter 8, a forecast was made for the development of the potato market until 2021
The study resulted in recommendations and conclusions.
Content
Part 1. OVERVIEW OF THE INDIAN POTATO MARKET
1.1. Main characteristics of the market
1.2. Dynamics of the potato market volume in 2010-2016 Market volume
1.3. Assessment of factors affecting the market
1.4. Potato Market Life Cycle Stage
1.5. Competition from substitute products
Part 2. COMPETITIVE ANALYSIS IN THE MARKET OF POTATOES
2.1. Major players in the market
2.2. Market shares of the largest competitors
2.3. Profiles of major players
Part 3. ANALYSIS OF POTATO PRODUCTION
3.1. Volume and dynamics of domestic potato production
3.2. Share of exports in potato production
3.3. Segmentation of potato production by region
3.3.1. Production by Union Territories
3.3.2. Production by states of India
Part 4. ANALYSIS OF FOREIGN TRADE SUPPLY OF POTATOES
4.1. Volume and dynamics of potato imports
4.2. Import structure
4.3. Volume and dynamics of potato exports
4.4. Export structure
Part 5. ANALYSIS OF POTATO CONSUMPTION
5.1. Dynamics of potato consumption
5.2. Analysis of the results of tenders for the purchase
Part 6. PRICE ANALYSIS
6.1. Average Producer Prices by Union Territories
6.2. Average consumer prices by states in India
Part 7. ASSESSMENT OF FACTORS OF INVESTMENT ATTRACTIVENESS OF THE MARKET
Part 8. POTATO MARKET FORECAST UP TO 2020
Part 9. RECOMMENDATIONS AND CONCLUSIONS
Chart example
Research excerpt
“..During 2011-2016. the dynamics of potato exports from India in monetary terms had a wave-like character. Thus, in 2012 and 2014, the volume of exports showed a negative trend (“minus” …% and “minus” …%, respectively) due to a decrease in potato exports in physical terms. In 2015, there was a significant increase in export volumes due to the record harvest in India and the devaluation of the rupee. The volume of exports in 2016 amounted to … million US dollars, which is …% more than in 2015. The lowest export value for the period 2011-2016. noted in 2011 and 2014. The volume of exports amounted to … million US dollars.…”
Diagrams
Chart 1. Potato price trends in India, 2011-2016
Diagram 2. Dynamics of the potato market volume in 2011 - 2015, thousand Rs.
Diagram 3. Revenue (net) from the sale of potatoes in the union territories for 2011 - 2016,%
Chart 4. Population change in India, 2011-2016
Diagram 5. Dynamics of India's GDP, 2012-2016, % to the previous year
Chart 6. The dynamics of the US dollar against the rupee, Jan. 2015-Dec. 2016, Rs. for 1 US dollar
Diagram 7. Dynamics of real incomes of the population of India, 2011 - 2016
Diagram 8. Shares of the largest competitors in the potato market in 2016
Diagram 9. Dynamics of potato production in India for 2011 - 2016
Chart 10. Structure of potato production in India, 2011-2016
Diagram 11. Dynamics of the total revenue of the largest producers (TOP-5) of potatoes in India, 2011-2016
Diagram 12. Shares of companies in the total revenue of the largest producers (TOP-5) of potatoes in India, 2014-2016
Diagram 13. The share of exports in the production of potatoes by agricultural organizations, peasant farms and entrepreneurs for 2011 - 2015
Diagram 14. Volume and dynamics of potato imports in physical terms, 2011-2016
Diagram 15. Volume and dynamics of potato imports in monetary terms, 2011-2016
Diagram 16. Dynamics of potato exports in monetary terms, 2011-2016
Diagram 17. Dynamics of potato exports in physical terms, 2011-2016
Diagram 18. Balance of exports and imports
Diagram 19. Structure of exports by countries in 2015-2016
Diagram 20. Dynamics of potato consumption in physical terms, 2011 - 2016
Diagram 21. Dynamics of potato consumption in monetary terms, 2011 - 2016
Diagram 22. Forecast of potato consumption in the market in 2016-2020, thousand Rs.
Tables
Table 1. Classification of potatoes
Table 2. Industrial production index by state of India (in % of the previous year), 2011 - 2016
Table 3. The dynamics of the US dollar against the rupee, Jan. 2015-Dec. 2016, Rs. for 1 US dollar
Table 4. STEP analysis of factors affecting the potato market
Table 5. Characteristics of goods-substitutes for the product ""potato""
Table 6. Main companies participating in the Indian potato market in 2016
Table 7. The main companies participating in the Indian potato market in 2016
Table 8. Total sales of TOP-5 manufacturers in the Indian market in 2016
Table 9. Dynamics of potato production in India by region
Table 10. Dynamics of potato production by states of India, 2011-2016
Table 11. Structure of potato imports by importing countries in 2016
Table 12. Data on tenders for the purchase of potatoes over 500 thousand Rs., announced from 13.02.17 to 12.03.17
Table 13. Average producer prices for potatoes in the Union Territories, 2011-2016, thousand Rs./t.
Table 14. Average consumer prices for potatoes by states of India, 2011-2016, Rs./kg.
Table 15. Factors of investment attractiveness of the potato industry
All reports