Analysis of the pellet market in India
The relevance of research
Pellets are widely used in both domestic and industrial use. Fuel pellets are valued for their environmental friendliness. The production, storage and transportation of pellets eliminate environmental pollution, and when burned, they practically do not emit carbon dioxide and sulfur dioxide, and the ash can be used as fertilizer.
Another advantage of pellets is the ability to automate boiler equipment. A single load of a small bunker will allow 2-3 weeks not to approach the boiler at all.
Using pellets is also very economical. At a lower consumption, they release more heat energy than alternative fuels. The efficiency of pellet boilers is up to 90%.
Purpose of the study
Analysis of the state of the pellet market, assessment of the market volume, analysis of competitors, as well as identification of factors affecting the pellet market.
Content
Part 1. Overview of the Indian Pellet Market
1.1. Main characteristics of the market
1.2. Dynamics of the pellet market volume in 2012-2016 Market volume
1.3. Assessment of factors affecting the market
1.4. Pellet Market Life Cycle Stage
1.5. Competition from substitute products
Part 2. Competitive analysis in the pellet market
2.1. Major players in the market
2.2. Market shares of the largest competitors
2.3. Profiles of major players
Part 3. Pellet Production Analysis
3.1. Volume and dynamics of domestic pellet production
3.2. Export share in pellet production
3.3. Segmentation of pellet production by regions
3.3.1. Production by Union Territories
3.3.2. Production by states of India
Part 4. Analysis of foreign trade deliveries of pellets
4.1. Volume and dynamics of imports of pellets
4.2. Import structure
4.3. Volume and dynamics of pellet exports
4.4. Export structure
Part 5. Pellet consumption analysis
5.1. Pellet Consumption Volume Dynamics
5.2. Analysis of the results of tenders for the purchase
Part 6. Price Analysis
6.1. Average producer prices by union territories
6.2. Average consumer prices by states in India
Part 7. Assessment of factors of investment attractiveness of the market
Part 8. Forecast for the development of the pellet market until 2021
Part 9. Recommendations and conclusions
Research excerpt
Part 1. Overview of the Indian Pellet Market
1.1. Main characteristics of the market
The object of this study are pellets.
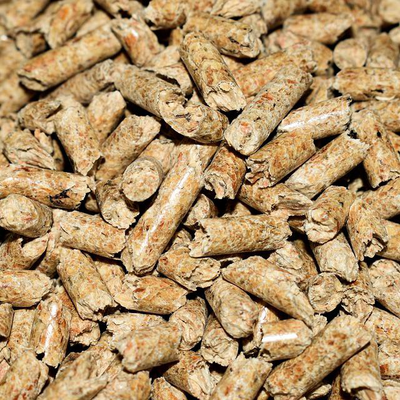
Pellets (fuel granules) are a type of biofuel in the form of cylindrical granules obtained from wood waste, agricultural waste or peat. Pellets can be considered a relatively new type of fuel. The first use of compressed wood waste began in North America in the 70s of the last century, and the first sales of pellets on the consumer market were made in 1983.
Diagram 2. The ratio of imported and domestic products in the Indian pellet market, %
1.2. Dynamics of the pellet market volume in 2012-2016 Market volume
Consider the dynamics of the volume and capacity of the pellet market in India.
Within the framework of this question, it is necessary to consider two points of view on the size of the pellet market in India - for domestic consumption and within the framework of output for export.
Given that most of the production is exported, the market for domestic pellet consumption in India is small. In 2016, its value amounted to … million Rs., and by the end of 10 months of 2017 it was already … million Rs. In real terms, the market volumes amounted to … thousand tons, respectively.
Diagram 3. Dynamics of the volume of the Indian pellet market for domestic consumption, 2012 - 10 months of 2017, million Rs.
1.3. Assessment of factors affecting the market
Let's consider the main factors influencing the pellet market and, accordingly, the demand.
...
1.4. Pellet Market Life Cycle Stage
The pellet market is at the growth stage of the life cycle. This is evidenced by:…
1.5. Competition from substitute products
Compared to traditional fuels, pellets have a number of important advantages: …
Part 2: Competitive Analysis of the Pellet Marketт
2.1. Major players in the market
For a long time, the Indian market could be characterized as a monopoly, due to the presence of one strong player on it - “…” LLC, which provided about 30-40% of all exports and has a production potential of … thousand tons per year. However, the commissioning of new large production facilities and problems at “…” LLC led to a change in the market paradigm, now there are a dozen strong players on the market that export about …% of the total export volume.
...
2.2. Market shares of the largest competitors
At the end of 2016, the Indian leaders in the production and export of pellets were LLC “..” (12,0%), CJSC “…” (9,6%), LLC “…” (8,5%), OJSC “… ""(7,5%), LLC"" ... ""(5,0%).
Diagram 10. Shares of leading manufacturers in the Indian pellet market in 2016
2.3. Profiles of major players
...
Part 3. Pellet Production Analysis
3.1. Volume and dynamics of domestic pellet production
Dynamics of domestic production of pellets for 2012-2017 is characterized by positive values, except for 2013. Thus, in 2013 the output of pellets decreased by …%, and then only increased: in 2014 - by …%, in 2015 - by …%, in 2016 - on the …%. According to the results of 10 months of 2017, the growth of domestic production amounted to …% compared to the corresponding period of 2016, and the volume in absolute terms reached the level of … thousand tons.
Diagram 11. Dynamics of pellet production in India for 2012 - 10 months of 2017, thousand tons
3.2. Export share in pellet production
According to GidMarket estimates, almost the entire volume of pellets produced in India is exported abroad. In 2016-2017 the share of export in production amounted to …%.
Diagram 14. Share of exports in Indian pellet production for 2012 - 10 months. 2017
3.3. Segmentation of pellet production by regions
3.3.1. Production by Union Territories
According to the data of Rosstat, according to the results of 10 months of 2017, the largest volume of pellet production fell on … the Union Territories (47,6%). Also, the largest territories include ... Union Territories (11,2%), ... Union Territories (10,7%) and ... Union Territories (8,4%). In other federal districts, the shares are less significant: … Union Territories – 1,9%, … Union Territories – 0,1%.
...
3.3.2. Production by states of India
According to Rosstat, in 2016 the largest pellet production regions in India were … reg. (20,4%), … (13,4%), … reg. (10,9%) and … (9,4%). Together, these territories accounted for slightly more than half of Indian production.
Chart 15. Pellet production by states of India in 2016, %
Part 4. Analysis of foreign trade deliveries of pellets
4.1. Volume and dynamics of imports of pellets
In 2016, the volume of imported products increased to … thousand tons, and by the end of 10 months of 2017 it reached … thousand tons.
Diagram 16. Volume and dynamics of imports of pellets in physical terms, thousand tons
4.2. Import structure
According to the results of 2016, … and … were the main importing countries of pellets to India. Together, these countries accounted for almost 90% of total imports.
...
4.3. Volume and dynamics of pellet exports
According to the data of the Federal Customs Service, the export of pellets from India in 2012 amounted to … thousand tons in physical terms. In 2013, the volume of exported products decreased by …% to the level of … thousand tons.
...
4.4. Export structure
At the end of 2016, the largest recipient country of Indian-made pellets was … (37,2%). The second and third lines are shared among themselves ... (12,1% each). Together, these countries accounted for just over 60% of total exports.
...
Part 5. Pellet consumption analysis
5.1. Pellet Consumption Volume Dynamics
Due to the export orientation of the production of pellets in India, the volume of domestic consumption, according to GidMarket estimates, is insignificant.
...
5.2. Analysis of the results of tenders for the purchase
For the period from 15.11.17/15.12.17/64,2 to / / . it was announced ... tenders for the purchase of pellets. The total amount was million Rs.
...
Part 6. Price Analysis
6.1. Average producer prices by union territories
According to Rosstat, following the results of 10 months of 2017, the highest prices of pellet producers were established in … Union Territories (5 Rs/ton), the lowest – in … Union Territories (635,8 Rs/ton).
...
6.2. Average consumer prices by states in India
According to GidMarket estimates based on Rosstat data, in 2016 the highest consumer prices for pellets were observed in … (17,4 Rs/kg), … region. (13,6 Rs/kg) and … (13,1 Rs/kg). The lowest prices can be noted in … region. (1,5 Rs/kg), … (1,7 Rs/kg) and … region. (1,8 Rs/kg).
...
Part 7. Assessment of factors of investment attractiveness of the market
...
Part 8. Forecast for the development of the pellet market until 2021
...
Part 9. Recommendations and conclusions
...
Diagrams
Chart 1. Seasonal coefficient of pellet production in India
Diagram 2. The ratio of imported and domestic products in the Indian pellet market, %
Diagram 3. Dynamics of the volume of the Indian pellet market for domestic consumption, 2012 - 10 months of 2017, million Rs.
Diagram 4. Dynamics of the volume of the Indian market of pellets in terms of release for export, 2012 - 10 months of 2017, million Rs.
Diagram 5. Revenue (net) from the sale of pellets by union territories for 2012–10 months of 2017, %
Diagram 6. Dynamics of pellet production in the world, 2012-2016, million tons
Diagram 7. Dynamics of wood production volume in India, 2012-2016, million m3
Diagram 8. Average nominal exchange rate of Rs. to USD
Diagram 9. Dynamics of the population of India, million people
Diagram 10. Shares of leading manufacturers in the Indian pellet market in 2016
Diagram 11. Dynamics of pellet production in India for 2012 - 10 months of 2017, thousand tons
Diagram 12. Dynamics of the total revenue of the largest manufacturers (TOP-5) of pellets in India, 2012-2016, billion Rs.
Diagram 13. Shares of companies in the total revenue of the largest manufacturers (TOP-5) of pellets in India, 2012-2016
Diagram 14. Share of exports in Indian pellet production for 2012 - 10 months. 2017
Chart 15. Pellet production by states of India in 2016, %
Diagram 16. Volume and dynamics of imports of pellets in physical terms, thousand tons
Diagram 17. Volume and dynamics of imports of pellets in monetary terms, mln USD
Diagram 18. Volume and dynamics of export of pellets in physical terms, thousand tons
Diagram 19. Volume and dynamics of export of pellets in monetary terms, mln USD
Diagram 20. Balance of exports and imports in the Indian pellet market in 2012 - 10 months of 2017, thousand tons
Diagram 21. The structure of exports of pellets from India by recipient countries in 2016
Diagram 22. Dynamics of domestic consumption of pellets in 2012 - 10 months of 2017, thousand tons
Diagram 23. Forecast of the pellet market in India in 2017-2021, thousand tons
Figure 1. Pellet market segments by application
Figure 2. Pellet consumption forecast for the main countries until 2020, million tons
Tables
Table 1. STEP analysis of factors affecting the pellet market in India
Table 2. Comparison of various energy sources
Table 3. Major companies participating in the Indian pellet market in 2016
Table 4. Total sales of TOP 5 pellet manufacturers in the Indian market in 2016
Table 5. Dynamics of pellet production in India by union territories, thousand tons
Table 6. Structure of imports of pellets by sending countries in 2016
Table 7. Data on tenders for the purchase of pellets, announced from 15.11.17/15.12.17/2 to / / , in the amount of more than million Rs.
Table 8. Average prices of pellet producers in the Union Territories, 2012 – 10 months of 2017, Rs/ton
Table 9. Average consumer prices for pellets by states of India, 2016, Rs/kg
Table 10. Assessment of factors of investment attractiveness of the pellet market
All reports