Analysis of the millet market
The relevance of research
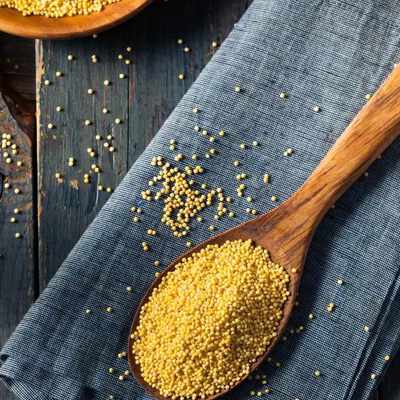
Millet is a cereal obtained from millet. As a result of millet processing, only the kernel is preserved - all shells and the germ are removed during the grinding process. Millet is used to make crumbly cereals, casseroles, puddings, kulesh, etc. Currently, only polished millet is produced. Depending on the quality indicators, millet is divided into the highest, first, second and third grades. Millet is more drought-resistant than other types of cereals, but it is very afraid of frost.
Purpose of the study
Analysis of the state of the millet market, assessment of the market size, analysis of competitors, as well as identification of factors affecting the millet market
Content
Part 1. Overview of the Indian millet market
1.1. Main characteristics of the market
1.2. Dynamics of the volume of the millet market 2015-2019 Potential market capacity
1.3. Assessment of factors affecting the market
1.4. Millet market life cycle stage
1.5. Competition from substitute products
Part 2. Competitive analysis in the millet market
2.1. Major players in the market
2.2. Market shares of the largest competitors
2.3. Profiles of major players
Part 3. Analysis of millet production
3.1. Volume and dynamics of domestic production of millet
3.2. Share of exports in millet production
3.3. Segmentation of millet production by regions
3.3.1. Production by Union Territories
3.3.2. Production by states of India
Part 4. Analysis of foreign trade supplies of millet
4.1. The volume and dynamics of millet imports
4.2. Import structure
4.3. The volume and dynamics of millet exports
4.4. Export structure
Part 5. Analysis of millet consumption
5.1. Dynamics of millet consumption
5.2. Analysis of the results of tenders for the purchase
Part 6. Price Analysis
6.1. Average producer prices by union territories
6.2. Average consumer prices by states in India
Part 7. Assessment of factors of investment attractiveness of the market
Part 8. Forecast for the development of the millet market until 2024
Part 9. Recommendations and conclusions
Research excerpt
Part 1. Overview of the Indian millet market
1.1. Main characteristics of the market
Millet is a cereal obtained from millet. As a result of millet processing, only the kernel is preserved - all shells and the germ are removed during the grinding process. Millet is used to make crumbly cereals, casseroles, puddings, kulesh, etc. Currently, only polished millet is produced. Depending on the quality indicators, millet is divided into the highest, first, second and third grades. Millet is more drought-resistant than other types of cereals, but it is very afraid of frost.
...
In the period 2015-2019 the share of domestic products amounted to almost …% of the market volume.
...
1.2. Dynamics of the volume of the millet market 2015-2019 Potential market capacity
Consider the dynamics of the volume of the millet market in India.
In 2019, the volume of the millet market in physical terms amounted to … tons, which is …% more than in 2018. The main factor in changing the volume of the millet market in physical terms in India is the level of domestic production of this product. So, in 2019, an increase in millet production was the result of an increase in the gross harvest of millet, from which this cereal is produced. Millet harvest in 2019 amounted to … thousand tons against … thousand tons in 2018.
...
As of October 2020, there is a positive growth trend in the millet market in India – the growth rate for 10 months of 2020 amounted to …% compared to the same period in 2019.
Diagram 5. Dynamics of the volume of the millet market in 2015-2019, Jan.-Oct. 2020, tons
Potential market capacity
Based on the analysis of the dynamics of the millet market volume for 2015-2019. the Indian market annually receives about … thousand tons of millet. The volume varies depending on the size of the cultivated areas of millet, from which millet is produced.
The potential capacity of the millet market in India can be estimated at not less than … to the actual market volume, which will be about … thousand tons
...
1.3. Assessment of factors affecting the market
Let's consider the main factors influencing the market and, accordingly, demand.
Economic
- Dynamics of GDP - a macroeconomic indicator that reflects the market value of all final goods and services (that is, intended for direct consumption) produced per year in all sectors of the economy on the territory of the state for consumption, export and accumulation.
...
Chart 8. Dynamics of India's GDP, 2012-2019, Q2020 , % to the previous year
– Retail trade turnover is an indicator of the effective demand of the population and the level of real incomes of the population.
In 2017-2019 there was a recovery in retail trade turnover, after falling in 2015-2016. Thus, in 2018, the retail trade turnover increased by …% compared to 2017, in 2019 – by …% compared to 2018. In 2015-2016. retail trade growth rates were negative. In 2017-2019, the growth rate is positive, but not high. After a decline in 2015-2016 retail trade turnover in 2019 did not recover to the level of 2014
...
– The level of real incomes of the population
During the period 2014-2017. the dynamics of real incomes of the population was negative. Thus, in 2014 real incomes decreased by …% as compared to 2013, in 2015 – by …% as compared to 2014, in 2016 – by …% as compared to 2015, in 2017 – decreased by …% compared to 2016, in 2018, after a long-term decline, the real money income of the population showed a positive trend – the increase amounted to …%, compared to 2017. In 2019, there was also an increase in the income of the population – an increase amounted to …% compared to 2018. According to the data for the I-III quarter of 2020, the incomes of the population again show a negative trend (the real income of the population decreased by …%). For the same period in 2019, the growth rate of real income was positive and amounted to …%.
...
– Depreciation of the rupee
The growth of the exchange rate has a negative impact on the millet market to a greater extent. The negative impact of the factor is manifested in an increase in the cost of production and processing of products, since the share of imports in operating costs is high.
...
Political
– Implementation of the import substitution policy. The agrarian policy of India is aimed at import substitution and increasing exports. Today, the Indian agro-industrial complex reliably provides the domestic market with basic foodstuffs. At the beginning of 2019, Indian President Vladimir Putin approved a new Doctrine of the country's food security for 2019-2021, which provides for complete self-sufficiency in the main types of agricultural products and increasing their availability for the entire population. The influence of this factor is positive.
...
– State programs to support the industry. As part of the support for investment lending to the agro-industrial complex of India, part of the costs of paying interest on investment loans in the field of crop production, animal husbandry, dairy and beef cattle is reimbursed. As Prime Minister of India Mikhail Mishustin explained, preferential investment loans for agricultural producers have already been provided for today. And now those who create new jobs and increase the competitiveness of Indian agricultural products will receive additional support. The positive influence of the factor.
technological
– Restoration of acreage of millet.
In 2019, 51,3% more areas were used for sowing millet than in 2018. The restoration of sown areas led to an increase in the gross harvest of millet and an increase in domestic production of millet - millet groats. According to the results of the spring accounting in 2020, the sown area expanded by 14% compared to 2019. The influence of the factor on the millet market in India is positive.
- Breeding and seed production in India.
Breeding and seed production of agricultural crops play a decisive role in the production of agricultural products and ensuring its competitiveness.
To date, selection in India is going through hard times. The main problems of breeding and seed production in India are:
– Dependence of domestic agricultural producers on imports of planting material, seeds, mechanization and chemicalization means. India is dependent on foreign selection for many crops. So, for example, according to the Center for Technology Transfer (CTT), 62% of the sown area of corn is occupied by imported varieties, for soybean - 26% of the sown area, for rapeseed - 88%. However, it should be noted that domestic varieties are mainly sown for wheat - 97% of crops.
...
– The penetration of genetically modified seeds into India.
The issue of penetration of genetically modified seeds into India is very acute. In 2018, two giants producing GM crops, Bayer and Monsanto, merged.
...
– Increasing crop yields and disease resistance.
Currently, the largest share of any modern increase in production in agricultural enterprises is due to technological innovations that increase crop yields. Instead of expanding areas to increase production, as was done in the past, agricultural enterprises today seek to minimize crop losses and increase yields. Indian agricultural producers are focused on intensive growth in the yield of grains and legumes, which implies an increase in production volumes not due to the expansion of areas, but due to the effective use of modern agricultural technologies and the use of high-yielding and resistant varieties. The influence of the factor is positive.
– Automation of production processes in the agro-industrial complex.
One of the key factors in improving the efficiency of agricultural enterprises is an increase in the share of machine labor and automation of production processes in the agro-industrial complex. The incentive for the introduction of advanced technologies in the work of agricultural enterprises is the high cost of land, which farmers want to use as efficiently as possible. To have good profitability at a high price for land, it is necessary to produce a lot of products and high quality, which is impossible without the use of modern technologies and digitalization. The influence of the factor is positive.
Социальные
- Population. During 2011-2018 India's population has shown a positive trend. However, since 2019, the population has decreased due to the natural population decline in 2017-2018. And if in 2017 the natural population decline was compensated by migration growth (“plus” 211,9 thousand people), then in 2018 the migration growth turned out to be less than the natural population decline – the migration growth in 2018 amounted to 124,9 thousand people. people In 2019, the natural decline in the population was also less than the migration gain - the natural decline amounted to 317,2 thousand people, the migration increase - 285,1 thousand people.
...
– Growth of the urban population. According to Rosstat, as of January 1, 2020, the urban population in India amounted to 109,5 million people, having increased by 2010 million people since 4,2. Along with the absolute growth of the urban population, its share in the total number also increases (from 74% in 2010 to 75% at the beginning of 2020). The growth of the urban population has a positive effect on the development of the millet market, since the urban population consumes more cereal products than the rural population. On average, a city dweller eats various types of cereals by 25-30% more than a rural dweller. This is due to the more diverse diet of the villagers due to the presence of their own fruits and vegetables, meat and dairy products.
...
– Reorientation of consumer preferences. There are more and more consumers who monitor their nutrition and food quality every year. Therefore, in the cereal market in India, there is an increase in demand for higher quality products, cereals, ready-made breakfast cereals, etc. The predominance of cereal quality over cost is most typical for large cities and metropolitan areas. Here, the decisive factors for making a purchase are the name of the brand (preferably domestic), and then the price of the product itself.
...
- Increasing demand for branded products. In connection with the growth of the share of network retail in the Indian cereal market, the consumption of “no-name” products and small packers, which cannot compete with large producers, is declining. Private label (PB) consumption is declining as the consumer's demand for quality and variety increases, and PTMs are predominantly low-end and lower quality than branded products. Buyers are increasingly opting for branded cereals, while giving preference to domestic brands.
...
1.4. Millet market life cycle stage
The millet market is at the stage of early maturity of the life cycle. This is evidenced by:
- reduction of acreage of millet,
- slowdown in market growth,
- decrease in domestic production of millet,
- increasing requirements for product quality by consumers,
- players are optimizing the existing assortment
1.5. Competition from substitute products
The main competitors as millet substitutes include pasta and other types of cereals (buckwheat, rice, oatmeal, pearl barley, semolina).
At present, the popularity of millet among consumers is declining, and in case of a possible shortage, this crop can be easily replaced by rice or buckwheat. The size of the cultivated areas of millet is decreasing, in its place those crops are sown for which there is an active international trade (wheat, rice, corn). Farmers are switching to crops that Indian and international buyers are more willing to buy.
In order to stimulate demand for millet groats in the domestic market, producers are forced to optimize their assortment. Despite the fact that the cereal market is considered one of the most traditional and “non-marketing”, it can be said that consumers are gradually changing their preferences, they are increasingly opting for branded cereals in cooking bags. The main activities that allow companies to increase sales of cereals, including millet, are assortment optimization, timely, high-quality display, design of points of sale, staff work at the point of sale, as well as external communications - advertising in the media, outdoor advertising, etc. d.
Part 2. Competitive analysis in the millet market
2.1. Major players in the market
Due to the fact that the Indian millet market is characterized by the predominance of domestic products, Indian operators are among the largest producers of this product.
...
2.2. Market shares of the largest competitors
At the end of 2019, the leader among millet producers is .. occupying …% of the millet market in India in physical terms. The second place was taken by the company …, which accounted for …% of the market. The third place is occupied by … – …% of the market volume. Then, with a small margin, follows ... (...%).
...
Diagram 14. Shares of the largest competitors in the millet market in 2019, %
2.3. Profiles of major players
...
Part 3. Analysis of millet production
3.1. Volume and dynamics of domestic production of millet
According to GidMarket's estimate, based on the official statistics and revenues of the main millet producers in India, the volume of millet production in 2019 amounted to … tons, having increased by …% compared to 2018.
...
Over the period from 2015, millet production in India in 2019 increased by …% in physical terms.
...
The TOP-5 domestic millet producers include …, …, …, …, …. In 2019, the total revenue of the TOP-5 millet producers amounted to … billion Rs., having increased by …% compared to 2018. According to GidMarket, the total revenue of the TOP-5 millet enterprises in 2020 will be approximately … billion Rs.
Diagram 17. Dynamics of the total revenue of the largest producers (TOP-5) of millet in India, 2015-2020, million Rs.
3.2. Share of exports in millet production
...
3.3. Segmentation of millet production by regions
3.3.1. Production by Union Territories
The main millet production facilities in India are located in …, … and … federal districts.
...
3.3.2. Production by states of India
...
The largest millet-producing states in India are …, where in 2019 this product produced …% of the total production volume in physical terms, then, in descending order of share in production, follow … (…%), … (…%), … (…%), … (…%), … (…%), … (…%), Orenburg region (…%). Other states account for about …% of millet production in physical terms.
Part 4. Analysis of foreign trade supplies of millet
4.1. The volume and dynamics of millet imports
The Indian millet market is dominated by domestic products. Millet imports to India are insignificant and do not affect the domestic market of this product. So, in 2019, millet imports to India amounted to … tons, while the production volume was … tons. The growth rate for 10 months of 2020 compared to the same period in 2019 was negative and amounted to -…%.
...
4.2. Import structure
...
Table 5. Structure of millet imports by importing countries in 2019, Jan-Oct 2020
4.3. The volume and dynamics of millet exports
In 2019, the volume of export supplies of millet from India shows a negative trend, which is associated with a decrease in the millet harvest in 2017-2018. At the end of 2019, the volume of millet exports amounted to … tons, which is …% less than in 2018.
...
In value terms, the volume of millet exports from India in 2019 amounted to … million Rs., having increased by …% compared to 2018, which was associated with an increase in millet prices. The growth rate of millet exports from India for 10 months of 2020 increased by …% compared to the same period in 2019.
...
4.4. Export structure
The main supplies of Indian millet in 2019 fell on ... The key importer was ..., where ... tons of millet or ...% of total exports in volume terms were supplied. The second place in terms of export volume is occupied by …, whose share amounted to (…%).
...
Part 5. Analysis of millet consumption
5.1. Dynamics of millet consumption
According to GidMarket, in 2019 the volume of millet consumption in value terms (in retail prices) amounted to … billion Rs., having increased by …% compared to 2018 due to the growth of the market volume in real terms. In the period from 2015 to 2019, the volume of millet consumption in value terms doubled from … billion Rs. up to … billion Rs. The key factor in the growth in consumption in value terms was the consumer price growth factor, the factor in the growth in consumption in physical terms in the analyzed period was secondary. In the period Jan.-Oct. In 2020, the volume of millet consumption amounted to … billion Rs., which is …% more than the indicator for the same period in 2019.
Diagram 27. Dynamics of millet consumption in monetary terms, 2015-2019, Jan.-Oct. 2020, million Rs.
5.2. Analysis of the results of tenders for the purchase
For the period from 01.01.19/01.12.19/ to / / . more than … tenders were announced for the purchase of millet in the amount of … thousand Rs. up to … million Rs. In the list of purchased products, millet is found both separately and in a set of supplies with other food products.
The main buyers of millet are preschool and school institutions, healthcare institutions, budgetary social service institutions, and other municipal budgetary institutions.
...
Part 6. Price Analysis
6.1. Average producer prices by union territories
The average producer price for millet in 2019 amounted to … rupees per 1 ton, which is by …% … prices in 2018. Compared to 2017, 2018 prices are … by …%.
Such ... millet in 2018-2019 mainly due to low supply. In 2017, the millet harvest amounted to … thousand tons, while in 2016 it was harvested … thousand tons. In 2018, the harvest of millet … up to … thousand tons. However, in August 2019, after the statistics on the results of the sowing campaign were published, prices for millet began to fall. According to Rosstat, millet crops increased by more than one and a half times. In December 2019, the price decline stopped, and in the first half. 2020 prices have gone up a bit.
...
6.2. Average consumer prices by states in India
Average consumer prices for millet in 2019 increased by …% compared to 2018. Thus, one kilogram of millet in 2019. cost on average … Rs. (in 2018 - ... Rs.). Millet does not belong to the cereals popular with Indians, but is included in the list of socially significant products, the prices of which are monitored by the state.
Among the three main cereal crops (buckwheat, rice, millet), millet has risen in price the most. According to official statistics, in 2019, compared to 2018, buckwheat rose in price by …%, to … Rs./kg, rice — by …%, to … Rs./kg.
...
List of diagrams
Chart 1. Structure of gross grain harvest in India, %, 2019
Diagram 2. Millet sown area in India, thousand ha, 2015-2019, first half 2020
Diagram 3. Gross harvest of millet in India in 2015-2019, thousand tons
Diagram 4. The ratio of imported and domestic products in the millet market, %
Diagram 5. Dynamics of the volume of the millet market in 2015-2019, Jan.-Oct. 2020, tons
Diagram 6. Dynamics of the volume of the millet market in 2015-2019, Jan.-Oct. 2020, million Rs.
Diagram 7. Revenue (net) from the sale of millet by union territories for 2015-2019, Jan.-Oct. 2020, %
Chart 8. Dynamics of India's GDP, 2012-2019, Q2020 , % to the previous year
Diagram 9. Dynamics of retail trade turnover, 2015-2019, Jan.-Oct. 2020, % to the previous year
Diagram 10. Dynamics of real money incomes of the population of India, 2015-2019, I-III quarters 2020, % to the previous year
Chart 11. Monthly dynamics of the US dollar against the rupee, 2014-Dec. 2020, Rs. for 1 US dollar
Chart 12. Population change in India, 2010-2020
Chart 13. Trends in urban population in India, 2010-2020
Diagram 14. Shares of the largest competitors in the millet market in 2019, %
Diagram 15. Dynamics of millet production in India for 2015-2019, Jan.-Oct. 2020, tons
Chart 16. Dynamics of millet production in India for 2015-2019, Jan.-Oct. 2020, million Rs.
Diagram 17. Dynamics of the total revenue of the largest producers (TOP-5) of millet in India, 2015-2020, million Rs.
Diagram 18. The share of exports in production for 2015-2019, Jan.-Oct. 2020, %
Chart 19. Structure of millet production in India by union territories, 2019, %
Chart 20. Structure of millet production in India, 2019, %
Chart 21. Volume and dynamics of millet imports to India in physical terms, 2015-2019, Jan.-Oct. 2020, tons
Chart 22. Volume and dynamics of millet imports to India in real terms, 2015-2019, Jan.-Oct. 2020, million Rs.
Diagram 23. The volume and dynamics of millet exports in physical terms, 2015-2019, Jan.-Oct. 2020, tons
Chart 24. Volume and dynamics of millet exports in value terms, 2015-2019, Jan-Oct 2020, million Rs.
Chart 25. Balance of exports and imports, 2015-2019, Jan-Oct 2020, million Rs.
Chart 26. Structure of exports by countries in 2019, %
Diagram 27. Dynamics of millet consumption in monetary terms, 2015-2019, Jan.-Oct. 2020, million Rs.
Chart 28. Dynamics of average producer prices for millet 2018-Oct.2020, Rs./t
Diagram 29. Forecast of Indian millet market volume in 2020-2024, tons
List of tables
Table 1. STEP analysis of factors affecting the millet market
Table 2. Main companies participating in the millet market in 2019
Table 3. Profiles of companies participating in the millet market in 2019
Table 4. Dynamics of millet production in India by union territories, 2015-2019, Jan.-Oct. 2020, tons
Table 5. Structure of millet imports by importing countries in 2019, Jan-Oct 2020
Table 6. Data on completed tenders for the purchase of millet, announced on 01.01.2020/01.12.2020/ - / /
Table 7. Average producer prices in the millet market by Union Territories, 2015-2019, Jan.-Oct. 2020, Rs./t
Table 8. Average consumer prices in the millet market by states of India
Table 9. Assessment of factors of investment attractiveness of the millet market
All reports