Analysis of the market for storage and warehousing services for oil and products of its processing
The relevance of research
Liquid fuel storage is an important part of the oilfield. In terms of importance, ensuring proper conditions for the placement of raw materials is not inferior to oil production and processing. If the rules are violated, fuel may lose its properties and fall in price.
Purpose of the study
Analysis of the state of the market for storage and warehousing of oil and oil products, assessment of the market size, analysis of competitors, as well as identification of factors affecting the market for storage and warehousing of oil and oil products
Content
Part 1. Overview of the Indian market for storage and warehousing services for oil and refined products
1.1. Definition and main characteristics of the analyzed market
1.2. Dynamics of the volume of the Indian market for storage and warehousing services for oil and products of its processing, 2015-2019
1.3. Market structure by type of service provided in India
1.4. Market Structure by Union Territories
1.5. Assessment of current trends and development prospects of the studied market
1.6. Assessment of factors affecting the market
1.7. Analysis of sectoral indicators of financial and economic activity
Part 2. Competitive analysis in the oil and oil products storage and warehousing services market in India
2.1. Major players in the market
2.2. Market shares of the largest competitors
2.3. Profiles of major players
Part 3. Analysis of consumption of oil storage and warehousing services
3.1. Consumption volume dynamics
3.2. Market saturation and perceived market potential in India.
3.3. Description of consumer preferences
3.4. Price analysis
Part 4. Assessment of factors of investment attractiveness of the market
Part 5. Forecast for the development of the market for storage and warehousing services for oil and oil products until 2024
Part 6. Conclusions on the prospects of creating enterprises in the study area and recommendations for current market operators
Research excerpt
Part 1. Overview of the Indian market for storage and warehousing services for oil and refined products
1.1. Definition and main characteristics of the analyzed market
Liquid fuel storage is an important part of the oilfield. In terms of importance, ensuring proper conditions for the placement of raw materials is not inferior to ...
Oil storage (oil depot, oil terminal) - an industrial facility for storing oil and oil products, maybe ...
As a rule, the oil storage receives ...
Tanks for storing oil products are built exclusively from ...
All engineering structures for the storage of petroleum products are divided into 3 main types: ...
The use of bunkers of each type is regulated ...
Storage device requirements
To maintain the proper quality of oil energy resources, it is necessary to ensure appropriate conditions for the placement of raw materials for the period of its placement.
There are a number of requirements for the arrangement of oil depots ...
The main technical conditions that the warehouse must comply with: ...
...
Fire safety
...
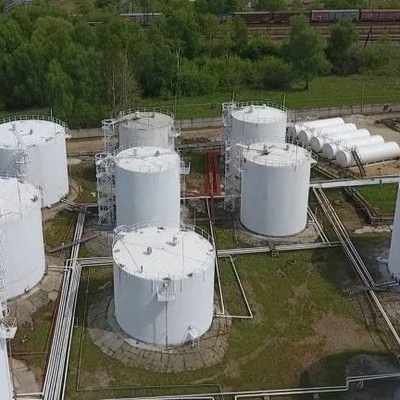
Types of storage containers
Placing oil products in containers of proper quality ensures the safety of …
Containers for storing raw materials differ in shape and material of manufacture.
Types of containers by material: ...
To prevent loss of oil products during storage, the following methods are used: ...
Compliance with these rules ensures the safety of energy resources.
1.2. Dynamics of the volume of the Indian market for storage and warehousing services for oil and products of its processing, 2015-2019
Consider the dynamics of changes in the volume of the market for storage and warehousing services for oil and products of its processing in India for the period 2015 - 2019.
The analyzed market belongs to the category of ... According to the preliminary results of 2019, according to the data of …, the market volume amounted to … billion Rs., which is by …% … of the indicators of 2018. The market occupies a significant share ...
The market is characterized by a steady trend ... In the medium term, it is planned to maintain ...
1.3. Market structure by type of service provided in India
According to their functional purpose (according to the principle of operational activity), tank farms are divided into:
Transshipment tank farms - designed for ...
According to the study, the main types of services provided within the considered market are the following:…
Ancillary activities include:
...
The share ratio is shown in the diagram below:
Diagram 2. Structure of the main services of the oil products storage market by type, %, 2019
The largest share in the structure of services is occupied directly by ... oil and oil products, in second and third place - by ... oil products. Related services take…
1.4. Market Structure by Union Territories
According to the analysis, at the end of 2019, the largest concentration of storage facilities providing storage and transshipment services for oil and oil products falls on … Union Territories, whose share is …% of the total market (see the diagram below):
The second place is occupied by … Union Territories (…%). On the third - ... Union Territories (...%).
1.5. Assessment of current trends and development prospects of the studied market
As of February 2020, the Indian market for oil storage and warehousing services is not yet... In 2020-2024 GidMarket analysts suggest...
The main market participants are ... holdings engaged in ...
...
The key trends in the modern Indian market for storage and warehousing services for oil and petroleum products are as follows: ...
1.6. Assessment of factors affecting the market
Let's consider the main factors influencing the market and, accordingly, the demand for storage and warehousing services for oil and refined products in India.
Economic forces
GDP dynamics
The dynamics of GDP determines the general vector of the country's economic development. As shown in the figure below, for the period 2011-2014. … annual growth of GDP was observed, and in 2015 the dynamics of GDP passed ... In general, the decline in GDP - …
Diagram 4. Dynamics of India's GDP, 2012 - Q3 2019, % to the previous period
According to the results of 2017, the dynamics of GDP … (see the diagram), but …, which indicates ... The volume of GDP in 2017 amounted to … billion Rs in current prices. The change in the vector of GDP dynamics in 2017 has … an impact on the market at the macroeconomic level, which led to …
...
In the long term, a gradual …% is expected in 2020, and above the level of …% starting from 2021. At the same time, the structure of GDP by use will shift significantly towards …
General trends in the development of the economy ... affect the growth in demand both for the purchase and transportation of petroleum products, and for storage and warehousing services.
Given the above, this factor has … an impact on the development of the analyzed market.
...
Social factors
...
Technological factors
...
Political factors
...
Table 2. STEP analysis of factors influencing the oil and oil products storage and warehousing services market in India
As can be seen from the results of the analysis, as of February 2020 ... the impact of environmental factors is quite large. However, taking into account ..., in total these factors have only ... value.
Experts also assume that in the long term a number of factors …
According to the analysis, in the period 2020-2024. the market for warehousing and storage of oil and oil products will keep …
1.7. Analysis of sectoral indicators of financial and economic activity
According to the data of Rosstat, the gross profitability of the oil and petroleum products storage and warehousing industry has … indicators relative to the gross profitability in all sectors of the economy. According to GidMarket’s calculations, the gross margin of the analyzed industry in 2018 is …%, which is by … p.p. … the same indicator for all sectors of the Indian economy. According to preliminary analysis, at the end of 2019, the gross margin in the field of storage and warehousing of oil will amount to …%, which is … the industry-wide indicator by …%.
Profitability indicators of profit before tax in the field of warehousing and storage of oil and petroleum products as a whole in the period 2014-2019 … similar financial ratios for all sectors of the Indian economy. As well as gross margin indicators, these financial ratios have ... GidMarket analysts predict ...
It should be noted that these figures represent…
Diagram 11. Profitability of profit before tax (profit of the reporting period) in the field of storage and warehousing of oil in comparison with all sectors of the Indian economy, 2013-2019, %
Formal values of current liquidity in 2013-2018 sectors calculated on the basis of official data indicate ... Basically, this indicator is ... At the end of 2018, current liquidity in the analyzed segment amounted to ... times. According to the preliminary forecast, by the end of 2019, the figure will be … times.
The absolute liquidity ratio shows what proportion of ... For Indian companies, the standard value of the absolute liquidity ratio is ... In the analyzed industry, absolute liquidity indicators calculated on the basis of official data are in ..., and are ... than the total indicators for all sectors of the Indian economy. Dynamics is...
In the analyzed period, business activity (average turnover period of receivables) in the field of storage of oil and oil products is characterized by ... a trend towards ... in 2014-2015, which is associated with ...
As of 2020, the indicator is moderately … (up to .. days), which is a … trend.
For the analyzed period, indicators of financial stability (provision of own working capital) in the segment … of the normative value (…%), which indicates …
In general, the analysis of sectoral financial ratios allows us to state …
Part 2. Competitive analysis in the oil and oil products storage and warehousing services market in India
2.1. Major players in the market
The table below shows the most significant players in the market at the end of 2019.
2.2. Market shares of the largest competitors
At the end of 2019, the largest player in the oil and oil products storage and warehousing services market is LLC “…”, whose share in value terms is …% of the total market volume. The second place is taken by LLC … (…% of the total market share). The third place is occupied by …(…%).
Estimating the exact market shares held by competitors is difficult due to the fact that…
It should be noted that the market is characterized as ... small companies organizing storage ...
Diagram 15. Shares of major players in the oil and petroleum products storage services market in India, 2019, %
2.3. Profiles of major players
OOO ""…""
...
Table 6. Basic information about the company XXXXX
The diagram below shows for reference the dynamics of the total revenue of the largest operators of the Indian market for storage and warehousing of oil and oil products
Chart 16. Dynamics of the total revenue of the largest market operators (TOP-5) in India, 2013-2019, million Rs.
As follows from the diagram, the total dynamics is characterized by ... a trend. The general trends in revenue changes among the TOP-5 market operators correspond to ... Decrease in revenue volumes in 2015-2016. largely due to...
A number of transactions … are recorded in the analyzed sector, mainly among … However, as of 2020, the number of … is quite large.
Part 3. Analysis of consumption of oil storage and warehousing services
3.1. Consumption volume dynamics
Based on the specifics of the market under study, oil storage and warehousing services are the most ... from which ... Due to the existing technological limitations and transportation difficulties, oil storage facilities are usually located in ...
General indicators of consumption of services for the storage and warehousing of oil and oil products in terms of per capita are shown in the diagram below:
Statistics fixes ... services in the analyzed segment in terms of per capita. According to the preliminary forecast, by the end of 2019, the figure will be … Rs. per person per year, which is by …% … of the result of 2018.
3.2. Market Saturation and Estimated Market Potential in India
...
3.3. Description of consumer preferences
...
3.4. Price analysis
Prices for oil and oil products storage services are differentiated depending on …
The table below shows the consumer price index.
As follows from the table above, prices for storage and warehousing of oil and oil products tend towards …, which corresponds to …
The table below shows the average prices for storage and warehousing services for oil and oil products.
As follows from the above table, the highest cost of oil storage services is in ... the Union Territories and ... the federal district.
Part 4. Assessment of factors of investment attractiveness of the market
... investment climate factors prevail over .. A comprehensive assessment of investment attractiveness factors is ... points - ... investment climate.
The most significant positive factors. …
The most significant negative factors. …
Part 5. Forecast for the development of the market for storage and warehousing services for oil and oil products until 2024
...
Part 6. Conclusions on the prospects of creating enterprises in the study area and recommendations for current market operators
...
Diagrams
Diagram 1. Dynamics of the volume of the Indian market for storage and warehousing of oil and products of its processing, 2015-2019, million Rs.
Diagram 2. Structure of the main services of the oil products storage market by type, %, 2019
Diagram 3. Structure of the oil storage and warehousing services market by Union Territories, %, 2019
Diagram 4. Dynamics of India's GDP, 2012 - Q3 2019, % to the previous period
Chart 5. The dynamics of the US dollar against the rupee, Jan. 2014 - December 2019, Rs. for 1 US dollar
Diagram 6. Dynamics of real incomes of the population of India, 2011 - 2019, %
Diagram 7. Price growth dynamics for AI-95 gasoline, 2013-2019, Rs. per liter
Diagram 8. Dynamics of oil production in India, 2013-2019, million tons
Diagram 9. Dynamics of the population of India, 2011-2019, people
Chart 10. Internet penetration dynamics in India, 2008-2019, %
Diagram 11. Profitability of profit before tax (profit of the reporting period) in the field of storage and warehousing of oil in comparison with all sectors of the Indian economy, 2013-2019, %
Diagram 12. Current liquidity (total coverage) in the field of storage and storage of oil for 2013-2019, times
Diagram 13. Business activity (average turnover period of receivables) in the field of storage and storage of oil, for 2013-2019, days
Diagram 14. Financial stability (security of own working capital) in the field of storage and warehousing of oil, in comparison with all sectors of the Indian economy, 2013-2019, %
Diagram 15. Shares of major players in the oil and petroleum products storage services market in India, 2019, %
Chart 16. Dynamics of the total revenue of the largest market operators (TOP-5) in India, 2013-2019, million Rs.
Diagram 17. Consumption of storage and warehousing services for oil and oil products per capita, 2013-2019, Rs./person
Diagram 18. Forecast of the volume of the oil and oil products storage services market in India, 2020-2024, million Rs.
Tables
Table 1. Population density in the largest regions of India, 2019, units rev.
Table 2. STEP analysis of factors influencing the oil and oil products storage and warehousing services market in India
Table 3. Gross profitability of the storage and warehousing industry of oil and oil products in comparison with all sectors of the Indian economy, 2014-2019, %
Table 4. Absolute liquidity in the field of storage and warehousing of oil in comparison with all sectors of the Indian economy, 2013-2019, times
Table 5. Main companies participating in the oil and oil products storage and warehousing services market, 2019
Table 6. Basic information about the company XXXXX
Table 7. Basic information about the company XXXXX
Table 8. Basic information about the company XXXXX
Table 9. Basic information about the company XXXXX
Table 10. Basic information about the company XXXXX
Table 11. Consumer price index for oil and oil products storage and warehousing services in India, 2014-2019, %
Table 12. Average prices for storage of petroleum products in tanks for 1 week, 2019, Rs. per ton
Table 13. Assessment of factors of investment attractiveness of the oil storage and warehousing services market in India
All reports