Analysis of the iron ore concentrate market in India
The relevance of research
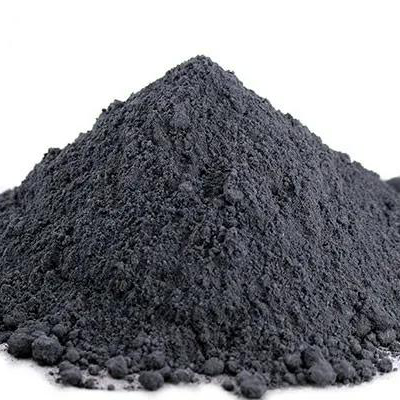
Iron ore concentrate is a product of deep enrichment of ore containing iron. Obtaining this raw material is the work of mining and processing plants, which bring the share of iron in the finished product to a maximum of 85-90% (the average is 60-65%). Externally, the iron ore concentrate looks like a powdery mass (granule size up to 0,05 mm). In order to subsequently use this powder more conveniently, the concentrate is sintered into agglomerates - raw materials prepared for steel smelting. Ferrous metallurgy is one of the basic branches of Indian industry, providing a significant contribution to the economic potential of the state.
Purpose of the study
Analysis of the state of the iron ore concentrate market, assessment of the market volume, analysis of competitors, as well as identification of factors affecting the iron ore concentrate market.
Content
Part 1. Overview of the Indian Iron Ore Concentrate Market
1.1. Main characteristics of the market
1.2. Dynamics of the market volume of iron ore concentrate 2013-2017 Market volume
1.3. Assessment of factors affecting the market
1.4. Stage of the life cycle of the iron ore concentrate market
1.5. Competition from substitute products
Part 2. Competitive analysis in the iron ore concentrate market
2.1. Major players in the market
2.2. Market shares of the largest competitors
2.3. Profiles of major players
Part 3. Iron ore concentrate production analysis
3.1 Volume and dynamics of domestic production of iron ore concentrate
3.2. The share of exports in the production of iron ore concentrate
3.3. Segmentation of iron ore concentrate production by regions:
3.3.1. Production by Union Territories
3.3.2. Production by states of India
Part 4. Analysis of foreign trade deliveries of iron ore concentrate
4.1. Volume and dynamics of imports of iron ore concentrate
4.2. Structure of imports by countries
4.3. The volume and dynamics of exports of iron ore concentrate
4.4. Structure of exports by countries
Part 5. Iron ore concentrate consumption analysis
5.1. Dynamics of consumption of iron ore concentrate
5.2. Analysis of the results of tenders for the purchase
Part 6. Price Analysis
6.1. Average Producer Prices by Union Territories
6.2. Average consumer prices by states in India
Part 7. Assessment of factors of investment attractiveness of the market
Part 8. Forecast for the development of the iron ore concentrate market until 2022
Part 9. Recommendations and conclusions
Research excerpt
Part 1. Overview of the Indian Iron Ore Concentrate Market
1.1. Main characteristics of the market
The concentrate can be called raw or non-agglomerated iron ore, which is obtained using magnetic separation technology. As a result, ore with 30% Fe can be enriched up to 60%.
Diagram 1. The ratio of imported and domestic products in the iron ore concentrate market, %
For the period 2013-2017 a total of … billion Rs was invested in the fixed capital of the iron ore mining and enrichment industry. The largest volume of investments was made in 2015 and in 2016: … billion Rs. and … billion Rs. respectively.
...
Diagram 2. Investments in fixed assets by industry mining and enrichment of iron ore, 2013-2017, billion Rs.
1.2. Dynamics of the market volume of iron ore concentrate 2013-2017 Market volume
According to GidMarket's calculations based on official statistics, at the end of 2017, the volume of the iron ore concentrate market amounted to … mln t, … by …% compared to 2016.
Diagram 3. Dynamics of the volume of the iron ore concentrate market in 2013-2017, mmt*
1.3. Assessment of factors affecting the market
Let's consider the main macro-factors influencing the iron ore concentrate market.
Economic forces
GDP dynamics
The dynamics of GDP determines the general vector of the country's economic development. As shown in Chart 5, for the period 2011-2014. there was a decrease in the annual GDP growth rate, and in 2015-2016. GDP dynamics has moved into the negative zone. On the whole, the decline in GDP is a very serious symptom; against its background, a significant part of business processes in the country is slowing down.
...
Demographic factors
Over the past eight years, the population of India has shown a positive trend. At the same time, in 2013–2016, there is a positive natural increase in the population. Population growth largely ensures migration growth. Population growth increases the potential demand for steel products now and in the future. The positive influence of the factor.
Chart 10. Population change in India, 2010-2018
1.4. Stage of the life cycle of the iron ore concentrate market
The iron ore concentrate market is at the stage of …
...
Part 2. Competitive analysis in the iron ore concentrate market
2.1. Major players in the market
The largest players in the iron ore concentrate market are …
2.2. Market shares of the largest competitors
According to GidMarket, based on data from market operators on production volumes and data from Rosstat, the leader of the iron ore concentrate market in India is …
Diagram 12. Shares of the largest competitors in the iron ore concentrate market in 2017
2.3. Profiles of major players
...
Part 3. Iron ore concentrate production analysis
3.1. Volume and dynamics of domestic production of iron ore concentrate
According to Rosstat, India produced 2017 million tons of iron ore concentrate in 94,8, which is by …% … of the 2016 level.
...
Diagram 15. Dynamics of iron ore concentrate production in India for 2013 - 2017, 5 months 2018
Diagram 16. Dynamics of the total revenue of the largest producers (TOP-5) of iron ore concentrate in India, 2013-2017
3.3. Segmentation of iron ore concentrate production by regions:
3.3.1. Production by Union Territories
In 2017, more than half of the volume of iron ore concentrate production in volume terms was accounted for by …
3.3.2. Production by states of India
In the geographical distribution by states of India, according to market operators, the largest share of production …
Part 4. Analysis of foreign trade supplies of iron ore concentrate
4.1. Volume and dynamics of imports of iron ore concentrate
In this study, the concept of import and export of iron ore concentrate includes import-export supplies corresponding to …
Diagram 19. Volume and dynamics of imports of iron ore concentrate in physical terms
4.2. Structure of imports by countries
Throughout the analyzed period, the main importer of iron ore concentrate to India has been...
4.3. The volume and dynamics of exports of iron ore concentrate
In physical terms, the export volume of non-agglomerated iron ores and concentrates to India in physical terms in 2017 amounted to …
Diagram 21. Dynamics of export of iron ore concentrate in physical terms
For five months of 2018, the volume of exports of non-agglomerated iron ore and concentrates amounted to ... $ million.
Diagram 22. Dynamics of exports of iron ore concentrate in monetary terms
4.4. Structure of exports by countries
In the structure of exports of non-agglomerated iron ore and concentrate in value terms by country, according to the results of 2017, …
Part 5. Iron ore concentrate consumption analysis
5.1. Dynamics of consumption of iron ore concentrate
When determining the volume of consumption of iron ore concentrate, the prices of producers of the specified product for the domestic market were used...
5.2. Analysis of the results of tenders for the purchase
...
Part 6. Price Analysis
6.1. Average Producer Prices by Union Territories
The average prices for the products of producers of iron ore concentrate supplied to the domestic market in India in May 2018 amounted to ... Rs./t ...
6.2. Average consumer prices by states in India
The iron ore concentrate market in India is characterized by the fact that the bulk of the concentrate produced by the largest concentrators is used internally.
...
Part 7. Assessment of factors of investment attractiveness of the market
...
Part 8. Forecast for the development of the iron ore concentrate market until 2022
...
Part 9. Recommendations and conclusions
...
Diagrams
Diagram 1. The ratio of imported and domestic products in the iron ore concentrate market, %
Diagram 2. Investments in fixed capital in the industry mining and enrichment of iron ore, 2013-2017, billion Rs.
Diagram 3. Changes in the volume of the iron ore concentrate market in 2013–2017, mmt*
Diagram 4. Revenue (net) from the sale of iron ore concentrate in the union territories for 2013 - 2017, %
Diagram 5. Dynamics of India's GDP, in 2012-2017, Q1 2018 % to the previous year
Diagram 6. Industrial production index of India, 2013 - 5 months. 2018, in % of the previous year
Diagram 7. Commissioning of residential real estate, 2013 - 5 months. 2018, mln sq.m*
Diagram 8. Dynamics of world prices for iron ore, 2011-2018 (forecast), $/ton
Diagram 9. The dynamics of the US dollar against the rupee, Jan. 2014 - July 2018, Rs. for 1 US dollar
Diagram 10. Population change in India, 2010-2018
Diagram 11. Stage of the life cycle of the iron ore concentrate market
Diagram 12. Shares of the largest competitors in the iron ore concentrate market in 2017
Diagram 13. Volume of production and shipments of iron ore concentrate by JSC Lebedinsky GOK, 2013-2017, million tons
Diagram 14. Volume of production and shipments of iron ore concentrate by PJSC Mikhailovsky GOK, 2013-2017, mln t
Diagram 15. Dynamics of production volumes of iron ore concentrate in India for 2013 - 2017, 5 months 2018*
Diagram 16. Dynamics of the total revenue of the largest producers (TOP-5) of iron ore concentrate in India, 2013-2017
Diagram 17. The share of exports in production for 2013 - 2017
Diagram 18. Structure of iron ore concentrate production by states of India, %
Diagram 19. Volume and dynamics of imports of iron ore concentrate in physical terms*
Diagram 20. The volume and dynamics of imports of iron ore concentrate in monetary terms
Diagram 21. Dynamics of export of iron ore concentrate in physical terms*
Diagram 22. Dynamics of export of iron ore concentrate in monetary terms*
Diagram 23. Average export and import prices for iron ore and concentrates, non-agglomerated, $/t
24 Chart. Balance of exports and imports
Diagram 25. Structure of exports by country in 2017
Diagram 26. Dynamics of consumption of iron ore concentrate in monetary terms 2013 - 2017, 5 months 2018*
Diagram 27. Forecast of market volume in 2018 - 2022, mln t
Tables
Table 1. STEP Analysis of Factors Affecting the Iron Ore Concentrate Market
Table 2. Key companies participating in the iron ore concentrate market in 2017
Table 3. Profiles of companies participating in the iron ore concentrate market in 2017
Table 4. Dynamics of iron ore concentrate production in India by region, thousand tons
Table 5. Structure of imports of iron ore concentrate by importing countries in 2013-2017, 5 months 2018
Table 6. Data on tenders for the purchase of iron ore concentrate in H2017 1-2018
Table 7. Average producer prices for iron ore concentrate in the Union Territories, Rs./t
Table 8. Average consumer prices for iron ore concentrate by state in India
Table 9. Assessment of factors of investment attractiveness of the iron ore concentrate market
Table 10. Forecast of Residential Entry and Industrial Production Growth in India, 2019-2022
All reports