Analysis of the grease market in India
The relevance of research
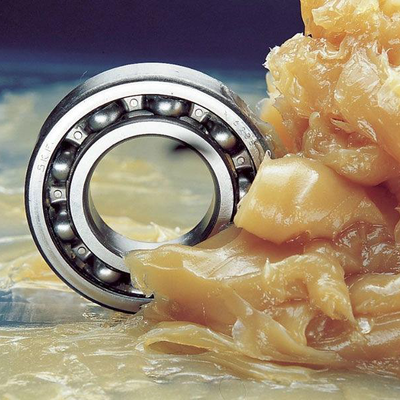
Greases have a number of performance properties that are not provided by either liquid or solid lubricants.
The main purpose of lubricants is to reduce wear of friction planes and increase the life of mechanism parts. In addition, lubricants prevent seizing, jamming, scuffing of friction surfaces. Almost all lubricants protect metal surfaces from corrosion, and also, due to their antifriction properties, reduce energy consumption for friction, which helps to reduce the power loss of mechanisms
Purpose of the study
Analyzing the state of the grease market, assessing the market size, analyzing competitors, and identifying factors affecting the grease market
Content
Part 1. Overview of the Indian Grease Market
1.1. Definition and main characteristics of the analyzed market
1.2. Dynamics of the grease market volume in 2014-2018 Potential market capacity
1.3. Factors affecting the market
1.4. Life cycle stage of the grease market
1.5.Competition from substitute products
Part 2: Competitive Analysis of the Grease Market in India
2.1. Major players in the market
2.2. Market shares of the largest competitors
2.3. Profiles of major players
Part 3: Grease production analysis
3.1. Volume and dynamics of domestic production of greases
3.2. Share of exports in the production of greases
3.3. Segmentation of grease production by regions
Part 4. Analysis of foreign trade supplies of greases
4.1. The volume and dynamics of imports of greases
4.2. Import structure
4.3. The volume and dynamics of exports of greases
4.4. Export structure
Part 5. Grease Consumption Analysis
5.1. Consumption volume dynamics
5.2. Analysis of the results of tenders for the purchase
Part 6. Price Analysis
Part 7. Assessment of factors of investment attractiveness of the market
Part 8. Forecast for the development of the grease market until 2023
Part 9. Recommendations and conclusions
Research excerpt
Part 1. Overview of the Indian Grease Market
1.1. Definition and main characteristics of the analyzed market
Greases are a common type of lubricants, which are highly structured thixotropic dispersions of solid thickeners in a liquid medium. As a rule, lubricants are ...
Greases have a number of performance properties, ...
The main purpose of lubricants is ...
Physically, greases are...
Greases are most commonly used in...
...
Performance of greases: ...
Properties of greases: ...
Classification of greases ...
1.2. Dynamics of the grease market volume in 2014-2018 Potential market capacity
Consider the dynamics of changes in the volume of the grease market in India for the period 2014 - 2018.
In kind in the period 2014-2018. analyzed market were characterized by ... At the end of 2018, it should be concluded that the grease market is characterized by ... At the end of 2018, the market volume of … amounted to … tons, which is by …% … than …
...
The maximum drop in volumes falls on … years, which is associated with ...
The analysis allows us to note that some of the Indian small enterprises engaged in the production of plastic lubricants opened …
In the long term,…
The potential capacity of the Indian grease market, calculated under … conditions, is shown in the diagram below:
Diagram 2. Potential market capacity of greases in India, 2019-2023, tons
1.3. Factors affecting the market
Let's consider the main factors influencing the market and, accordingly, the demand for greases in India.
Economic forces
GDP dynamics
The dynamics of GDP determines the general vector of the country's economic development. As shown in the figure below, for the period 2011-2014. observed...
According to the results of 2017, the dynamics of GDP ... The volume of GDP in 2017 amounted to the current ... The change in the vector of GDP dynamics in 2017 has ...
...
According to preliminary data published by the Ministry of Economic Development of India at the beginning of 2019, this year it is planned ... In the long term, however, it is expected ...
According to the given data, as of the beginning of 2019, there is a trend ..., which characterizes ...
Social factors
...
Technological factors
...
Political factors
...
Table 2. STEP Analysis of Factors Affecting the Grease Market in India
As can be seen from the results of the analysis, as of August 2019, the negative impact of environmental factors …, which causes …
The general development trends of the Indian economy and the increase ... have ... an impact on the market. However …
1.4. Life cycle stage of the grease market
Traditionally, the stages of the life cycle of markets are usually divided into the following categories: ...
...
The development of the Indian grease market is currently in … stages. At the same time, the main needs are provided by ... According to official data ... The profitability of sales of Indian brands ...
1.5.Competition from substitute products
...
Part 2: Competitive Analysis of the Grease Market in India
2.1. Major players in the market
The grease market in India as of 2019 is characterized by a high percentage of ... Domestic production ... and, despite ..., still occupies less than ...% of the total market. Among other things, the 2015 crisis had a... The table below shows the most significant players in the Indian market as of 2019.
...
2.2. Market shares of the largest competitors
As of the beginning of 2019, the largest player in the Indian grease market is …, which accounts for …% of the market.
Shares of other domestic companies ..., the market is extremely strong ... Share of small market participants ...
This situation is directly related to...
2.3. Profiles of major players
OOO ""…""
...
Table 4. Basic information about the company XXXX
Company ""…""
...
Part 3: Grease production analysis
3.1. Volume and dynamics of domestic production of greases
The dynamics of domestic production is characterized by … a trend.
During 2014-2018 The volume of the market for domestic production of greases in physical terms was characterized by ... The market volume in physical terms at the end of 2018 amounted to ... thous. t., which is by …% … than the indicators of … years. Compared to 2014, the total …%.
This trend is largely related to …, which makes up to …% of the total market volume.
3.2. Share of exports in the production of greases
The share of exports in the production of greases ... Currently, a model with a high share of ... According to the Federal Customs Service, at the beginning of 2019, the share of exports of greases was ...% of total production.
Chart 10. Share of exports in the production of greases, 2013-2018, % of the total
The main directions of export supplies are ..., the main export region is ...
3.3. Segmentation of grease production by regions
The largest volume of production among all federal districts falls on …: according to the results of 2018, based on official data, …% of the total volume was produced there. In second place with a share of …% is … the federal district, in third place is …
...
Part 4. Analysis of foreign trade supplies of greases
4.1. The volume and dynamics of imports of greases
The volume of imports of greases to India is ... in the total volume of the estimated market. The share of imports in some of the periods, according to the statistics of the Federal Customs Service, reaches …%.
The diagram below shows the dynamics of imports of greases in the period from 2014 to 2018.
...
According to the results of 2018, the volume of imports of greases amounted to … thousand tons, which is …% lower than the volumes of … a year. This situation is primarily associated by analysts with ... In the long term, it is planned ...
4.2. Import structure
The main countries-suppliers of greases in India in 2018 were: … (…%), … (…%), … (…%).
Diagram 13. Main importers of greases, 2018,%
4.3. The volume and dynamics of exports of greases
The volume of Indian exports of lubricating greases is expressed as ... Basically it is ...
The dynamics of exports of greases by years is shown in the diagram below:
...
As follows from the analysis, at the end of 2018, the volume of exports of greases amounted to … tons, which is by …% … than in … year.
4.4. Export structure
At the end of 2018, the largest share (…%) of export deliveries of greases from India was sent to ... The second place was taken by …(…%). On the third - …
...
As follows from the analysis, export volumes are … This situation is due to the low level of …
Part 5. Grease Consumption Analysis
5.1. Consumption volume dynamics
The general dynamics of consumption volumes is connected with demand …
At present, the general consumption trend in India is characterized by…
Diagram 16. Dynamics of consumption of greases, 2013-2018, tons
The volume of demand in 2018, according to official data, amounted to … tons, which is …% lower than the level of … a year.
5.2. Analysis of the results of tenders for the purchase
...
Part 6. Price Analysis
The production of lubricating greases is represented by a very wide ... The table below shows the average prices for the most popular items.
Table 10. Average prices for greases, 2019, Rs.
Part 7. Assessment of factors of investment attractiveness of the market
...
... investment climate factors slightly prevail over .. A comprehensive assessment of investment attractiveness factors is ... points - ... investment climate.
The most significant positive factors. …
The most significant negative factors. …
The general prospects for the grease market in India in the medium term are assessed by the analysts of GidMarket …, it is predicted that ... Large investments …
Part 8. Forecast for the development of the grease market until 2023
...
Part 9. Recommendations and conclusions
...
Diagrams
Diagram 1. Dynamics of the market volume of greases in India, 2013-2018, tons
Diagram 2. Potential market capacity of greases in India, 2019-2023, tons
Diagram 3. Dynamics of India's GDP, in 2011-2018, % to the previous year
Diagram 4. The dynamics of the US dollar against the rupee, Jan. 2014 - December 2018, Rs. for 1 US dollar
Diagram 5. Dynamics of real incomes of the population of India, 2011 - 2018
Diagram 6. Population change in India, 2010-2018
Diagram 7. Internet penetration dynamics in India, 2008-2018, %
Diagram 8. Shares of major players in the grease market in India at the beginning of 2019
Diagram 9. Dynamics of grease production volume in India, 2013-2018, thousand tons
Diagram 10. Share of exports in the production of greases, 2013-2018, % of the total
Diagram 11. Distribution of grease production across the Union Territories, 2018, %.
Diagram 12. Dynamics of imports of greases, 2014 - 2018, tons
Diagram 13. Main importers of greases, 2018,%
Diagram 14. Dynamics of export of greases, 2014 - 2018, tons
Diagram 15. Main exporters of greases, 2018, %
Diagram 16. Dynamics of consumption of greases, 2013-2018, tons
Diagram 17. Forecast of the dynamics of the grease market, 2019-2023, billion Rs.
Diagram 18. Forecast of grease market dynamics, 2019-2023, tons
Tables
Table 1. Population density in the largest regions of India, 2018
Table 2. STEP Analysis of Factors Affecting the Grease Market in India
Table 3. Top Companies in the Indian Grease Market in 2019
Table 4. Basic information about the company XXXXX
Table 5. Basic information about the company XXXXX
Table 6. Basic information about the company XXXXX
Table 7. Basic information about the company XXXXX
Table 8. Basic information about the company XXXXX
Table 9. Data on tenders for the purchase of greases, 2017-2019
Table 10. Average prices for greases, 2019, Rs.
Table 11. Assessment of factors of investment attractiveness of the grease market
All reports