Analysis of the chilled trout market in India
The relevance of research
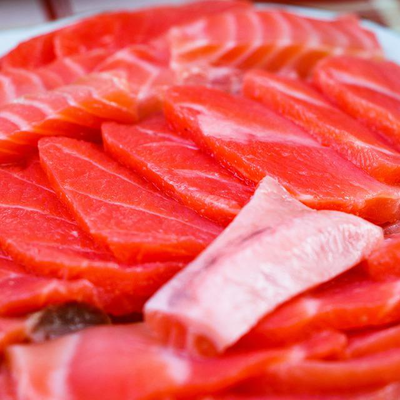
In India, the most common species of salmon as an object of farming is the rainbow trout. Trout farming is one of the leading areas of commercial aquaculture. In terms of rearing, salmon breeds take the second place after cyprinids and other herbivores (carp, silver carp, grass carp).
Purpose of the study
Analysis of the state of the chilled trout market, assessment of the market size, analysis of competitors, as well as identification of factors affecting the chilled trout market
Content
Part 1. Overview of the Indian chilled trout market
1.1. Main characteristics of the market
1.2. Chilled trout market volume dynamics 2015-2019 Potential market capacity
1.3. Assessment of factors affecting the market
1.4. Chilled trout market life cycle stage
1.5. Competition from substitute products
Part 2: Competitive Analysis in the Chilled Trout Market
2.1. Major players in the market
2.2. Market shares of the largest competitors
2.3. Profiles of major players
Part 3. Analysis of chilled trout production
3.1. Volume and dynamics of domestic production of chilled trout
3.2. Share of exports in chilled trout production
3.3. Segmentation of chilled trout production by regions
3.3.1. Production by Union Territories
3.3.2. Production by states of India
Part 4. Analysis of foreign trade supplies of chilled trout
4.1. Volume and dynamics of chilled trout imports
4.2. Import structure
4.3. Volume and dynamics of chilled trout exports
4.4. Export structure
Part 5. Analysis of consumption of chilled trout
5.1. Dynamics of consumption of chilled trout
5.2. Analysis of the results of tenders for the purchase
Part 6. Price Analysis
6.1. Average producer prices by union territories
6.2. Average consumer prices by states in India
Part 7. Assessment of factors of investment attractiveness of the market
Part 8. Market forecast for chilled trout until 2024
Part 9. Recommendations and conclusions
Research excerpt
Part 1. Overview of the Indian chilled trout market
1.1. Main characteristics of the market
In India, the most common species of salmon as an object of farming is the rainbow trout. Trout farming is one of the leading areas of commercial aquaculture. In terms of rearing, salmon breeds take the second place after cyprinids and other herbivores (carp, silver carp, grass carp).
...
According to the method of cutting, chilled fish can be:
- whole (uncut);
- gutted with a head, gutted decapitated.
Cutting prolongs the shelf life of fish, increases the yield of the edible part.
...
It should be noted that after the sanctions imposed on a number of countries, the share of imported products in the chilled trout market has significantly decreased. If in 2014 the share of imported chilled trout was …%, then in 2015 the share of foreign products was only …%. But gradually the share of imports grew and in 2019 reached …%.
Diagram 1. The ratio of imported and domestic products in the chilled trout market, %
The main sales volumes of chilled trout fall on the autumn-winter period, which is associated with the availability of fish (namely, during this season, fish grows minimally and is sold by farms) and high demand for the New Year holidays. The needs of chains and processors for fish are year-round.
1.2. Chilled trout market volume dynamics 2015-2019 Potential market capacity
In 2015, there was a significant reduction in the chilled trout market (by …%) against the backdrop of a significant reduction in imports and production volumes. Further throughout 2016-2019. the market volume grew. At the end of 2019, the volume of the chilled trout market in India amounted to … million Rs., having increased by …% compared to 2018. Average annual growth rate in 2015-2019 amounted to …%.
In physical terms, in 2019, the volume of the chilled trout market in India amounted to … tons, which is …% higher than in 2018.
Diagram 2. Dynamics of the market volume of chilled trout in 2015 - 2019, million Rs.
...
The actual capacity of the chilled trout market in 2019 reached … billion Rs. In 2019, per capita consumption of chilled trout was only 0,21 kg. At the same time, the consumption of fish products in general amounted to 20,2 kg/person, while the norm recommended by the Ministry of Health is 22 kg/person. In terms of the consumption rate (per person per year), in comparison with developed countries, such countries as Japan are in the lead, where the consumption rate is 65 kg, Norway - 55 kg, China - 25 kg per person per year. Thus, the chilled trout market in India has great potential for growth due to a decrease in the share of substitute torava, an increase in the purchasing power of the population, as well as the promotion of healthy and proper nutrition. The main limiting factor in achieving potential market capacity is the high cost of production.
In the structure of industry-wide revenue in the context of federal districts, the largest share falls on the North-Western Union Territories (…%). The share of other Union Territories accounts for about …% of industry revenue.
Diagram 3. Revenue (net) from the sale of chilled trout by union territories for 2019, %
1.3. Assessment of factors affecting the market
Let's consider the main factors influencing the market and, accordingly, demand.
Social (demographic)
During 2012-2018 India's population is on the rise. The increase in the population in 2015 was not only due to migration and natural increase, but also due to the formation of two new states of the Federation - the Republic of Crimea and the city of Sevastopol.
...
Economic
GDP is a macroeconomic indicator that reflects the market value of all final goods and services (that is, intended for direct consumption) produced per year in all sectors of the economy on the territory of the state for consumption, export and accumulation, regardless of the nationality of the factors of production used. It is the main, most complete official indicator of public welfare. The absolute and relative values of GDP give an idea of the general material well-being of the nation and the dynamics of its growth / decrease, since the higher the level of production, the higher the welfare of the country.
...
Chart 7. Dynamics of India's GDP, 2015-2020 (Jan.-Sept.),% of the previous year, trillion Rs.
...
technological
Until recently, the industry was completely dependent on the supply of initial breeding material, which comes from abroad. Live caviar for trout farms is imported from the USA, Europe and even South Africa. In addition to the original breeding material, feed is also purchased from abroad. This provokes a high degree of dependence of local commercial fisheries on imports, which in turn leads to higher prices for products and a decrease in their competitiveness. Negative influence of the factor. But at the same time, India began to develop its own production of initial breeding material, which favorably affects the development of the market.
Political
Government support for the industry. The import substitution policy contributed to the development of the industry. In addition, within the framework of the state program of India “Development of the fishery complex”, it is planned to provide subsidies from the federal budget to the budgets of the states of India to reimburse part of the costs of paying interest on loans received from Indian credit organizations by agricultural producers, for the development of aquaculture (fish farming) and commercial sturgeon farming.
...
Table 3. STEP Analysis of Factors Affecting the Chilled Trout Market
1.4. Chilled trout market life cycle stage
The chilled trout market in India is in a growth phase. The growth stage is very important for the company, as it creates the most favorable conditions for dominating the market and for increasing the profitability and stability of the company. All efforts at this stage should be aimed at extending it, at creating entry barriers for new players, at achieving maximum market coverage - all this will ensure the most comfortable existence of the company at the next stage of the life cycle.
...
The main task of marketing at this stage is its maximum extension, which is achieved by using all sources of growth and building entry barriers for new players.
1.5. Competition from substitute productsй
Chilled trout, in the first place, is experiencing competition from chilled salmon. Often, consumers call salmon and trout the same fish or simply find it difficult to identify the differences.
Similarities between salmon and trout:
- are incoming freshwater, that is, in most cases they live in salty waters, but go to freshwater to spawn. Due to the high demand for red varieties of fish, artificial breeding of salmon and trout has recently become popular;
- the body of both fish is covered with dark spots on the back and sides. In young individuals, they are more pronounced;
- ...
Differences between salmon and trout:
Salmon is much larger than trout, in natural conditions reaches one and a half meters in length and 40 kg of weight. The length of a trout usually does not exceed 30 cm, and its weight is not more than 4 kg.
...
Part 2: Competitive Analysis in the Chilled Trout Market
2.1. Major players in the market
Major players in the chilled trout market in 2018 are Indian Aquaculture PJSC, Kala Ya Maryapoyat LLC, Kala-Ranta JSC, Bioresurs LLC, F-Traut LLC (Miak APK GC). These companies occupy about a third of the chilled trout market (…%).
Calculation data of the Herfindahl-Hirschman Index in the chilled trout industry shows that this market belongs to low-concentration markets (market concentration is low). Mergers and acquisitions are allowed freely.
...
2.2. Market shares of the largest competitors
As of 2019, the largest operator of the chilled trout market in India is Indian Aquaculture PJSC, whose share is …%. “Kala ya maryapoyat” LLC and “Kala-Ranta” JSC occupy …% and …% of the market respectively. The share of Bioresurs Holding accounts for …% of the market. APK Miak Group occupies …% of the chilled trout market. Other companies account for …% of the market, the share of imported products – …%.
Diagram 12. Shares of major competitors in the chilled trout market in 2019, %
2.3. Profiles of major players
PJSC Indian Aquaculture
PJSC ""Indian Aquaculture"" is the leader in the Indian commercial aquaculture market, specializing in the cultivation of red fish - Atlantic salmon and rainbow trout.
PJSC ""Indian Aquaculture"" is present in two segments:
- commercial cultivation of rainbow trout in the Republic of Karelia;
- commercial cultivation of Atlantic salmon in the Murmansk region.
Currently, the group under the control of the Company owns the rights to 36 salmon and trout farming sites. The total volume of potential cultivation in these areas is about … thousand tons of red fish
LLC ""Kala I Maryapoyat""
Kala Ya Maryapoyat LLC was established in 1992. Since 2001, its main activity has been the breeding, processing and sale of rainbow trout.
Delicacy fish is grown on 6 trout farms located in the waters of the two largest lakes in northern Karelia - Upper Kuitto and Nyuk. At present, the capacity is 2000 tons of marketable trout per year. The production cycle of ""Kala ja marjapojat"" is based on the traditions and practices of Finnish trout breeders. The main attention is paid to the correct feeding of trout, control of its growth, timely sorting and transplanting.
...
Holding ""Bioresurs""
The holding owns three trout farms in the Leningrad region - Rybstandart, Salma and Priozerskaya Fish Company.
LLC ""Rybstandart"" produces marketable fish and planting material - trout, carp, sturgeon, whitefish. CJSC ""Agricultural enterprise Salma"" - marketable fish - trout, whitefish. OOO Priozersk Fish Company - marketable fish - trout.
...
Part 3. Analysis of chilled trout production
3.1. Volume and dynamics of domestic production of chilled trout
According to the Minister of Agriculture, Dmitry Patrushev, in recent years, the fishery complex has been developing dynamically, aquaculture is gaining momentum, and the volume of catch and production of domestic fish products is growing. Investments come to the industry, profitability and the number of profitable enterprises increase.
According to the Federal Agency for Fisheries, trout breeding is one of the leading areas of commercial aquaculture. In terms of rearing volume, salmon breeds occupy the second place in the structure of production after cyprinids and herbivores (carp, carp, silver carp, grass carp).
So, during 2016-2019. the production of chilled trout in India was growing, after a drop in production volumes in 2015 by …%. At the end of 2019, the volume of production of these products amounted to 222,16,6 thousand tons, which is …% higher than the values of 2018. Also, the volume of production in 2019 is the maximum in the study period.
The increase in the production of chilled trout is due to the withdrawal of Atlantic products from the market due to the embargo. At this time, the popularity of chilled Karelian trout grew in the Indian market. In addition, during the study period, fish farming in India received state support.
...
Estimating the total revenue of the market leaders is complicated by the fact that market operators provide data on revenue volumes for the company as a whole, without a breakdown by industry. However, the general dynamics can be traced.
..
As a consequence of the above-described feature of providing data on revenue, the revenue structure allows us to evaluate only competitive dynamics.
3.2. Share of exports in chilled trout production
For the period 2015-2019 the share of export in chilled trout production did not exceed …%. In 2017-2019 there was an increase in the share of production of chilled trout for export.
Diagram 15. The share of exports in the production of chilled trout for 2015 - 2019,%
3.3. Segmentation of chilled trout production by regions
3.3.1. Production by Union Territories
In terms of federal districts, the largest volume of production falls on the North-Western Union Territories, where the share of chilled trout production is …%. In aggregate, other federal districts account for …%.
...
3.3.2. Production by states of India
The leader in the chilled trout market is Karelia, which accounts for …% of the market in 2019. Over the past 10 years, the volume of commercial fish farming in Karelia has increased by … times. This fish of the salmon family is found in Onega, Ladoga lakes and other water bodies of Karelia and the Kola Peninsula, as well as in the basins of the Baltic and White Seas.
...
Diagrams
Diagram 1. The ratio of imported and domestic products in the chilled trout market, %
Diagram 2. Dynamics of the market volume of chilled trout in 2015 - 2019, million Rs.
Diagram 3. Revenue (net) from the sale of chilled trout across the union territories for 2019, %
Diagram 4. Dynamics of the population of India, as of January 1, 2012-2020, million people, thousand people
Diagram 5. Population forecast in India for the period 2021-2024, million people
Diagram 6. Dynamics of real incomes of the population of India, 2015-2020 (9 months), %
Diagram 7. Dynamics of India's GDP, 2015-2020 (Jan.-Sept.),% of the previous year, trillion Rs.
Diagram 8. Monthly dynamics of the US dollar against the rupee, 2015-2020, Rs. for 1 US dollar
Diagram 9. Dynamics of the inflation rate in India, 2015-2020 (Oct.), %
Diagram 10. Dynamics of the average interest rate on loans to legal entities, 2014-2020, %
Figure 11. Product life cycle
Diagram 12. Shares of major competitors in the chilled trout market in 2019, %
Diagram 13. Dynamics of production volumes of chilled trout in India for 2015 - 2019, tons
Diagram 14. Dynamics of the total revenue of the largest producers of chilled trout in India, 2015-2019, million Rs.
Diagram 15. The share of exports in the production of chilled trout for 2015 - 2019, %
Diagram 16. Chilled trout production by union territories, %
Diagram 17. Chilled trout production by states of India, 2019, %
Diagram 18. The volume and dynamics of imports of chilled trout in physical terms, 2015-2019, tons
Diagram 19. Volume and dynamics of imports of chilled trout in monetary terms, 2015-2019, thousand dollars
Diagram 20. Volume and dynamics of chilled trout exports in monetary terms, 2015-2019, USD
Diagram 21. The volume and dynamics of chilled trout exports in physical terms, 2015-2019, tons
Diagram 22. Balance of exports and imports, 2015-2019, thousand tons
Diagram 23. Chilled trout export structure by country, 2019
Diagram 24. Dynamics of consumption of chilled trout in physical terms, 2015 - 2019, thousand tons
Diagram 25. Market volume forecast for chilled trout in 2020 - 2024, million Rs.
Tables
Table 1. Fresh fish quality indicators
Table 2. Industrial production index by state of India (in % of the previous year), 2015 - 2019
Table 3. STEP Analysis of Factors Affecting the Chilled Trout Market
Table 4. The main differences between salmon and trout
Table 5. Nutritional and energy value of salmon and trout per 100 gr. product
Table 6. Useful substances in the composition of salmon and trout (percentage of the daily requirement in 100 g)
Table 7. The main companies participating in the chilled trout market in 2019
Table 8. Profiles of companies participating in the chilled trout market in 2019
Table 9. Structure of imports of chilled trout by importing countries in 2016-2020 (10 months), kg.
Table 10. Data on tenders for the purchase of chilled trout, announced from 01.10.20/20.11.20/ to / / .
Table 11. Average producer prices for chilled trout in the Union Territories, 2016-2019, thousand Rs./ton
Table 12. Average consumer prices for chilled trout in India, 2015-Sept. 2020, Rs./kg
Table 13. Factors of investment attractiveness of the chilled trout market
All reports