Analysis of the bean market in India
The relevance of research
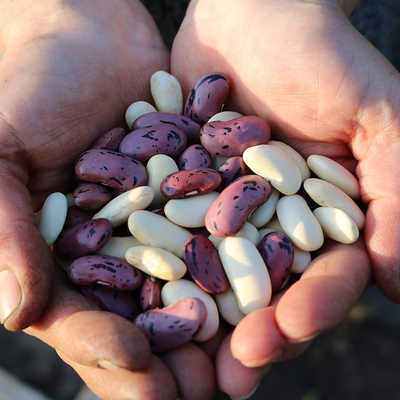
The subject of the study is beans, belonging to the group of legumes. The group ""grain legumes"" is limited to those crops, the fruits of which are harvested solely for the purpose of using dry grains.
Purpose of the study
Analysis of the state of the bean market, assessment of the market volume, analysis of competitors, as well as identification of factors affecting the bean market
Content
Part 1. Overview of the Indian bean market
1.1. Main characteristics of the market
1.2. Bean market volume dynamics 2014-2018 Potential market capacity
1.3. Assessment of factors affecting the market
1.4. Bean Market Life Cycle Stage
1.5. Competition from substitute products
Part 2. Competitive analysis in the bean market
2.1. Major players in the market
2.2. Market shares of the largest competitors
2.3. Profiles of major players
Part 3. Bean Production Analysis
3.1. Volume and dynamics of domestic bean production
3.2. Export share in bean production
3.3. Segmentation of bean production by regions
3.3.1. Production by Union Territories
3.3.2. Production by states of India
Part 4. Analysis of foreign trade supplies of beans
4.1. Volume and dynamics of imports of beans
4.2. Import structure
4.3. The volume and dynamics of exports of beans
4.4. Export structure
Part 5. Bean consumption analysis
5.1. Bean Consumption Dynamics
5.2. Analysis of the results of tenders for the purchase
Part 6. Price Analysis
6.1. Average producer prices by union territories
6.2. Average consumer prices by states in India
Part 7. Assessment of factors of investment attractiveness of the market
Part 8. Forecast for the development of the bean market until 2023
Part 9. Recommendations and conclusions
Research excerpt
Part 1. Overview of the Indian bean market
1.1. Main characteristics of the market
The subject of the study is beans, belonging to the group of legumes.
The group ""grain legumes"" is limited to those crops, the fruits of which are harvested solely for the purpose of using dry grains. Leguminous vegetables (such as green peas and green beans) and legumes whose fruits are used for the extraction of vegetable oil (such as soybeans and peanuts) and for fodder purposes (such as clover and alfalfa) are not legumes.
The Food and Agriculture Organization of the United Nations (FAO) gives the following classification of pulses:
Dried beans (Phaseolus spp.)
Common bean (Phaseolus vulgaris)
Moonbean (Phaseolus lunatus)
Fire-red beans (Phaseolus coccineus)
Holly bean (Phaseolus acutifolius)
Foreign trade in beans is accounted for under the TN VED codes:
0708 20 000 Legumes, whether or not shelled, fresh or chilled: beans (Vigna spp., Phaseolus spp.);
0713 39 000 1 Legume vegetables, dried, shelled, seeded or peeled, whether or not split: beans, for sowing;
0713 39 000 9 Legume vegetables, dried, shelled, seeded or peeled, whether or not split: beans, other;
0713 31 000 Legume vegetables, dried, shelled, seeded or peeled, whether or not split: beans of the species Vigna mungo (L.) Hepper or Vigna radiata (L.) Wilczek;
0713 32 000 0 Legume vegetables, dried, shelled, seeded or peeled, whether or not split: small red (adzuki) beans (Phaseolus or Vigna angularis).
In India, leguminous crops are of great food and fodder importance. The biological diversity of leguminous crops ensures their wide distribution throughout India. In India, large-seeded annual plants are grown: peas, soybeans, fodder beans, lentils, chin, beans, chickpeas, spring vetch, fodder lupine, etc.
...
Diagram 1. The ratio of imported and domestic products in the Indian bean market in 2014-2018, % of consumption
1.2. Bean market volume dynamics 2014-2018 Potential market capacity
The volume of the Indian bean market shows unstable dynamics: …
...
Diagram 2. Dynamics of the volume of the bean market in India in 2014 - 2018
Bean consumption per capita in India…
...
Table 1. Dynamics of proceeds (net) from the sale of beans in the union territories of India in 2014-2018, million Rs.
Diagram 4. Revenue (net) from the sale of beans by union territories for 2014 - 2018, %
1.3. Assessment of factors affecting the market
Let's consider the main factors influencing the market and, accordingly, the demand for beans in the Indian market.
Macroeconomic factors
In 2017-2018, the Indian economy showed a slight steady growth: ...
Social factors
Population
During 2014-2018, the resident population of India …
Real disposable income
...
Behavioral factors
...
Political and legal factors
Import substitution
Since the bean industry is highly dependent on imports, one of the main factors influencing the industry is the development of the Import Substitution Program in India…
Customs
Technological factors
For the bean market, as for any market in the field of crop production, the main technological factor is the combination of growing technology and natural and climatic conditions, which is expressed in crop yields.
...
Increasing the production of beans allows you to solve several problems at once:
Beans are a valuable crop in crop rotation, allowing to saturate the soil with nitrogen of biogenic origin. This is especially important when growing organic products.
Beans are an effective source of vegetable protein, which significantly increases the nutritional value;
Beans can be grown in low-fertility land, are drought tolerant, and store well. All this makes beans a valuable crop.
...
STEP analysis is used to assess the influence of the entire set of factors.
Table 2. STEP analysis of factors affecting the bean market
In general, the impact of macro factors on the bean market in India is currently assessed by GidMarket as …
1.4. Bean Market Life Cycle Stage
In the theory and practice of marketing, there are 4 stages of the life cycle of an industry: the stage of formation, the stage of growth, the stage of maturity, the stage of market aging.
The main characteristics of the bean industry in India, which determine the stage of the life cycle, are presented in the table.
...
Thus, the life cycle stage of the bean industry in India can be estimated as the stage of ...
1.5. Competition from substitute products
Substitute products for beans are other leguminous crops: peas, chickpeas, lentils, lupins.
...
Table 4. Dynamics of sown areas under leguminous crops in India in 2014-2018, thousand ha
The total harvest of leguminous crops for the period 2014-2018. …
Thus, competition from bean substitutes (other leguminous crops) in India is estimated as …
Part 2. Competitive analysis in the bean market
2.1. Major players in the market
Players in the market can be segmented as follows:
Bean producers - agricultural organizations and households
Producers of packaged beans
Importers and wholesalers of beans
...
It should be noted that both producers and traders specialize in beans only in isolated cases.
Agricultural producers grow beans along with other legumes (peas, lentils, chickpeas), traders sell a wide range of groceries (cereals, pasta, etc.).
2.2. Market shares of the largest competitors
The bean market is characterized by a low degree of concentration: the share of the 10 largest participants accounts for … the market.
2.3. Key player profilesв
The table shows the profiles of the main players in the bean market in India.
...
It should be noted that the largest sellers of packaged beans are based on imports, despite the production of several types of products at the enterprises of the holding (cereals, pasta), beans are not grown, but only packaged.
Part 3. Bean Production Analysis
3.1. Volume and dynamics of domestic bean production
The volume of bean production…
Diagram 15. Dynamics of bean production in India for 2014 - 2018
...
The volume of revenue of key producers for the period under review was affected by the volume of production and changes in prices in the domestic market.
3.2. Export share in bean production
Due to the outpacing of export growth rates over production growth rates, the share of exports in production increased ... in 2014 to ... in 2018.
3.3. Segmentation of bean production by regions
3.3.1. Production by Union Territories
The largest contribution to the production of beans in India is made by ... the federal district. In 2018, its share in the total Indian production amounted to … . In second place in the production of beans ...
For the period 2014-2018 the share of federal districts in total Indian output changed little.
3.3.2. Production by states of India
In India, beans are grown in 26 regions. The first place in terms of gross collection among them is occupied by …
...
Part 4. Analysis of foreign trade supplies of beans
4.1. Volume and dynamics of imports of beans
Since the bean market is highly dependent on imports, imports significantly exceed production.
In 2018, there was again…
...
4.2. Import structure
In 2018, beans in India were imported mainly from…
....
The three largest importing countries in 2018 supplied … thousand tons to the market.
4.3. The volume and dynamics of exports of beans
The export of beans from India is uneven over the years: in 2016, there was a significant …
...
Due to the unstable dynamics of foreign economic activity, especially exports, the ratio of exports and imports varies slightly over the years, but the main trend remains.
4.4. Export structure
The main export volume of beans from India falls on three countries: ...
In terms of value, the structure is somewhat different, the main part falls on …
It should be noted that the export of beans from India is unstable not only in terms of volume, but also in the structure of exports by country, which indicates the fragmented nature of export deliveries.
Part 5. Bean consumption analysis
5.1. Bean Consumption Dynamics
The volume of consumption of beans in value terms (in wholesale prices) …
Diagram 25. Bean consumption dynamics in monetary terms 2014 - 2018
Total for the period from 2014 to 2018. the volume of consumption of beans in value terms ...
Market dynamics were affected by changes in the volume of production and imports, as well as wholesale prices for beans in India.
5.2. Analysis of the results of tenders for the purchase
The analysis of tenders for the purchase was carried out according to the following parameters:
Time period - January-October 2019
Geography - India.
Scope of supply over 10 kg.
Supply of bulk beans.
...
The analysis carried out allows us to conclude ...
Part 6. Price Analysis
6.1. Average producer prices by union territories
Average producer prices for white beans (without VAT) are estimated on average for January-June 2019 at the level of …
...
The highest price level is observed ...
6.2. Average consumer prices by states in India
On the retail market, beans are sold mainly in packages of …
...
Part 7. Assessment of factors of investment attractiveness of the market
The investment attractiveness of the market is assessed based on an analysis of a combination of factors: sales potential, demand potential, barriers, main trends, competitiveness.
...
Part 8. Forecast for the development of the bean market until 2023
We will analyze the market based on methods based on identifying trends over time, adjusted for expert opinion in the industry.
When making the forecast, the influence of the following factors was taken into account: ...
Part 9. Recommendations and conclusions
The situation in the market
...
Macroeconomic factors affecting the considered market
In general, the impact of macro factors on the bean market in India is currently assessed by GidMarket as …
Conclusions about the prospects for the development of enterprises operating in this market ...
The prospects for the development of enterprises in the Indian bean market are associated with the influence of the following factors:
...
Recommendations for entering the market / development in the market
...
Diagrams
Diagram 1. The ratio of imported and domestic products in the Indian bean market in 2014-2018, % of consumption
Diagram 2. Dynamics of the volume of the bean market in India in 2014 - 2018
Diagram 3. Dynamics of bean consumption per capita in India in 2014-2018, kg/year
Diagram 4. Revenue (net) from the sale of beans in the union territories for 2014 - 2018, %
Diagram 5. India's GDP Volume Index 2012-2018
Diagram 6. Dynamics of the average annual exchange rate, Rs./$ in 2014-2018
Diagram 7. Consumer price index in India in 2013-2018
Diagram 8. Population dynamics in India, as of January 1, 2014-2019
Diagram 9. Dynamics of real income of the population of India, 2014-1-3 Q.2019
Diagram 10. Pulse crop yields in India 2014-2018
Diagram 11. Structure of cultivated areas of leguminous crops in India, 2018
Diagram 12. The yield of leguminous crops in India, on average for 2014-2018, tons / ha
Diagram 13. Structure of the gross harvest of leguminous crops in India, 2018
Diagram 14. Shares of the largest competitors in the bean market in 2018
Diagram 15. Dynamics of bean production volumes in India for 2014 - 2018
Diagram 16. Dynamics of the total revenue of the largest producers (TOP-5) of beans in India, 2014-2018
Diagram 17. The share of exports in production for 2014 - 2018
Diagram 18. The volume and dynamics of imports of beans in India in 2014-2018 in kind
Diagram 19. The volume and dynamics of imports of beans in India in 2014-2018 in value terms
Diagram 20. Dynamics of export of beans from India in 2014-2018, in physical terms
Diagram 21. Bean export dynamics from India in 2014-2018, in value terms
Diagram 22. Balance of export and import of beans in India in 2014-2018, tons
Diagram 23. Structure of exports by countries in physical terms in 2018
Diagram 24. Structure of exports by countries in physical terms in 2018
Diagram 25. Bean consumption dynamics in monetary terms 2014 - 2018
Diagram 26. Forecast of the bean market volume in 2019 - 2023
Tables
Table 1. Dynamics of proceeds (net) from the sale of beans in the union territories of India in 2014-2018, million Rs.
Table 2. STEP analysis of factors affecting the bean market
Table 3. Bean market life cycle stage in India
Table 4. Dynamics of sown areas under leguminous crops in India in 2014-2018, thousand ha
Table 5. Yield dynamics of leguminous crops in India in 2014-2018, tons/ha
Table 6. Dynamics of the gross harvest of leguminous crops in India in 2014-2018, tons
Table 7. The main companies participating in the bean market in 2018
Table 8. Profiles of bean market participants in 2018
Table 9. Main indicators of bean production in India in 2014-2018
Table 10. Dynamics of bean production in India by union territories in 2014-2018
Table 11. Dynamics of bean production in India by states of India in 2014-2018
Table 12. Bean import structure by importing countries in 2018
Table 13. Analysis of tenders for the purchase of beans in India in January-October 2019
Table 14. Average producer prices for beans in the Union Territories in 2014-January-June 2019, thousand Rs./ton
Table 15. Average consumer prices for beans in the states of India in 2014-January-September 2019, Rs./kg
Table 16. Assessment of factors of investment attractiveness of the bean market
All reports